Illustration Plot Coverage Probabilities
Source:R/manCTMed-illustration-fig-scatter-plot-coverage.R
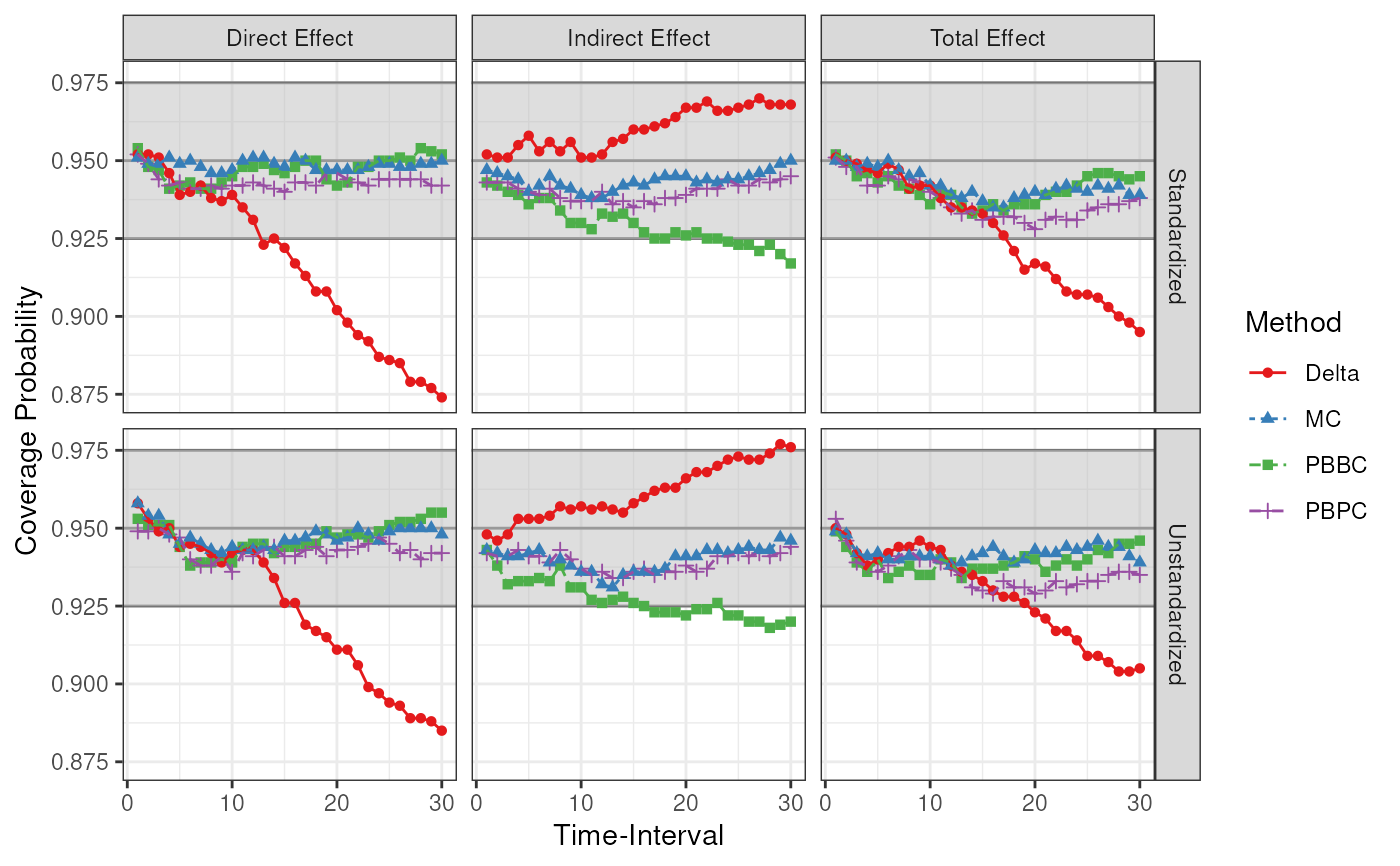
IllustrationFigScatterPlotCoverage.RdCoverage probabilities for the model \(X \to M \to Y\).
Examples
data(illustration_results, package = "manCTMed")
IllustrationFigScatterPlotCoverage(illustration_results)