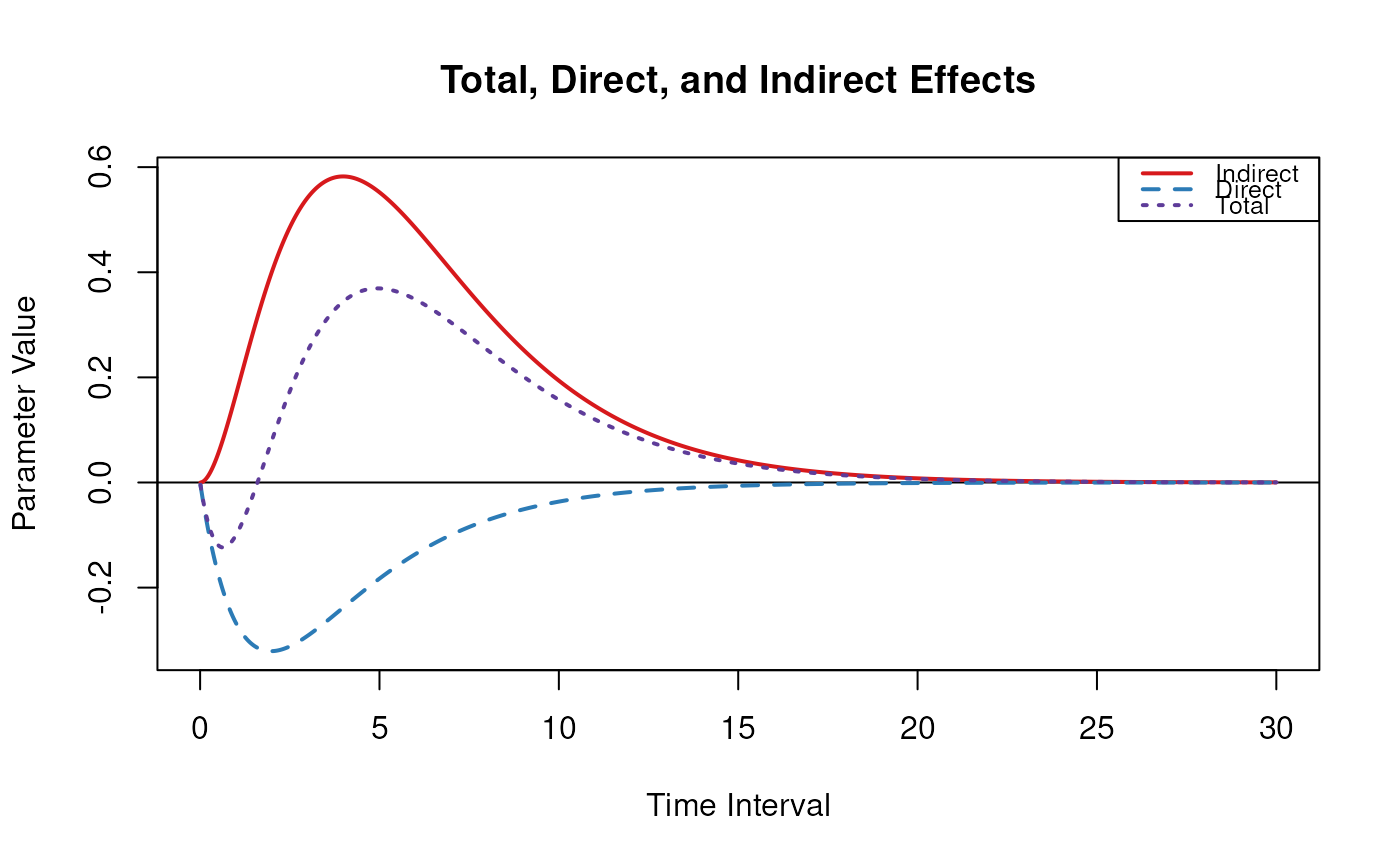
Effects for the model \(X \to M \to Y\).
Arguments
- dynamics
Integer.
dynamics = 0for original drift matrix,dynamics = -1for near-neutral dynamics, anddynamics = 1for stronger damping.- std
Logical. If
std = TRUE, standardized total, direct, and indirect effects. Ifstd = FALSE, unstandardized total, direct, and indirect effects.- max_delta_t
Numeric. Maximum time interval.
- xmy
Logical. If
xmy = TRUE, plot the effects for thex-> m -> ymediation model. Ifxmy = FALSE, plot the effects for they -> m -> x` mediation model.