Plot Total, Direct, and Indirect Effects (Illustration)
Source:R/manCTMed-illustration-fig-plot-effects.R
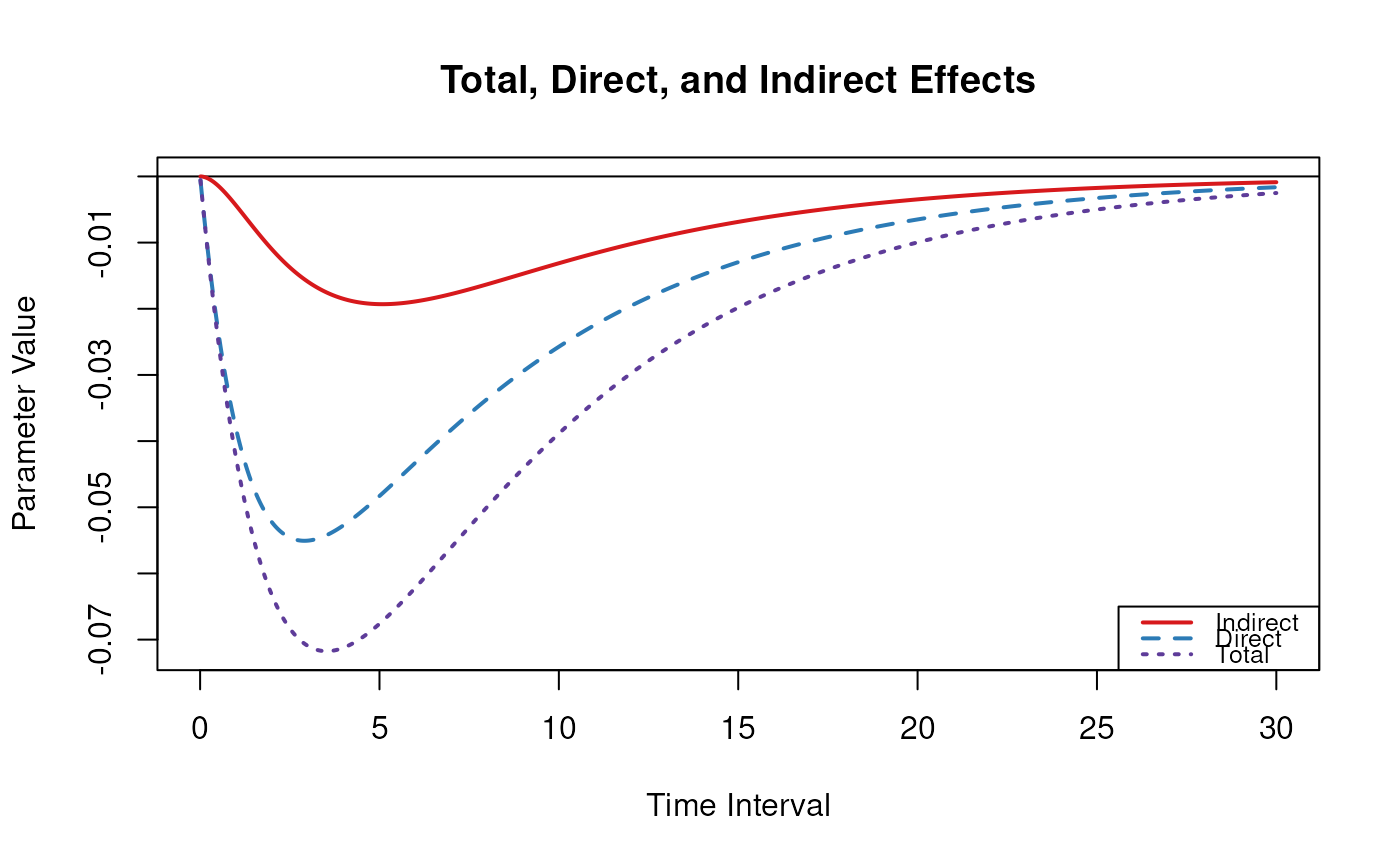
IllustrationFigPlotEffects.RdEffects for the model \(X \to M \to Y\).
Examples
IllustrationFigPlotEffects(std = FALSE)
#>
#> phi:
#>        x      m      y
#> x -0.138  0.000  0.000
#> m -0.124 -0.865  0.434
#> y -0.057  0.115 -0.693

IllustrationFigPlotEffects(std = TRUE)
#>
#> phi:
#>        x      m      y
#> x -0.138  0.000  0.000
#> m -0.124 -0.865  0.434
#> y -0.057  0.115 -0.693
#>
#> sigma:
#>      [,1] [,2] [,3]
#> [1,]  0.1  0.0  0.0
#> [2,]  0.0  0.1  0.0
#> [3,]  0.0  0.0  0.1
IllustrationFigPlotEffects(std = TRUE)
#>
#> phi:
#> x m y
#> x -0.138 0.000 0.000
#> m -0.124 -0.865 0.434
#> y -0.057 0.115 -0.693
#>
#> sigma:
#> [,1] [,2] [,3]
#> [1,] 0.1 0.0 0.0
#> [2,] 0.0 0.1 0.0
#> [3,] 0.0 0.0 0.1
