Presented below are scatter plots of Type I error rates, statistical
power, and miss rates. See FigScatterPlot() for more
details on the plots below.
results_no_adj <- results
results_no_adj <- results_no_adj[
  which(
    !(
      results_no_adj$method %in% c("MC.MI.ADJ", "SIG.MI.ADJ")
    )
  )
  ,
]
results_no_adj$method <- factor(results_no_adj$method)
Complete Data
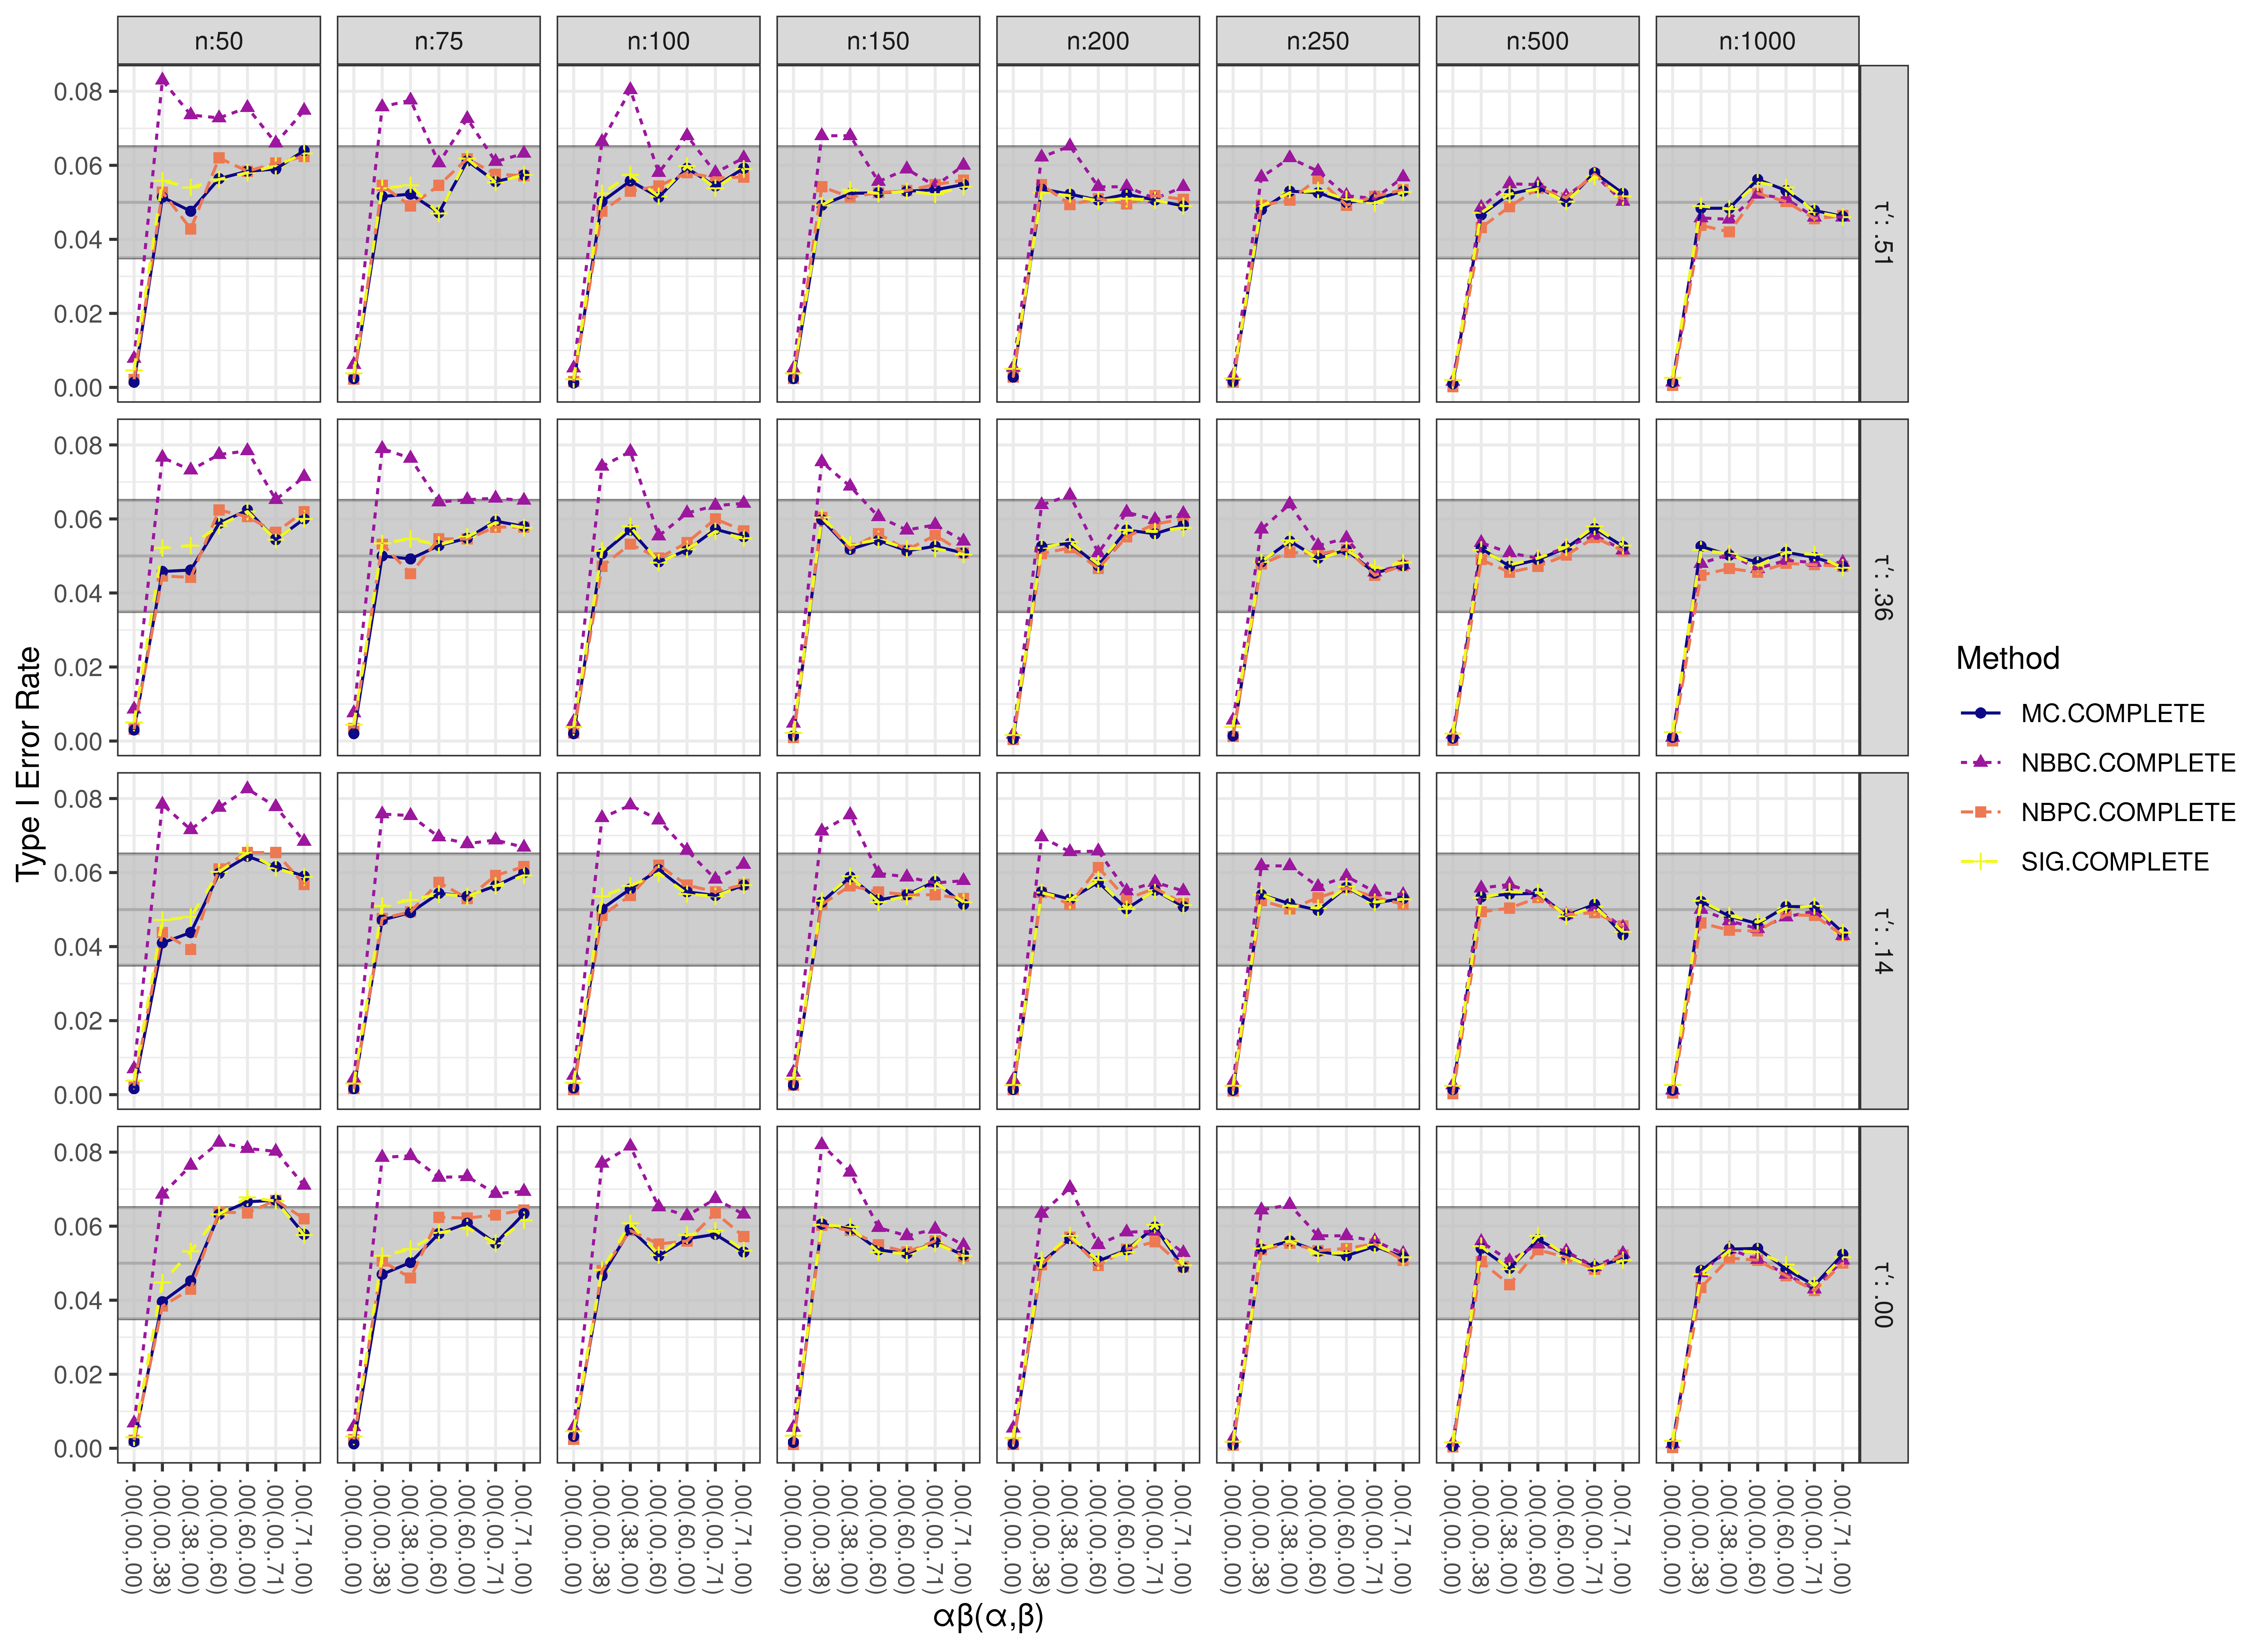
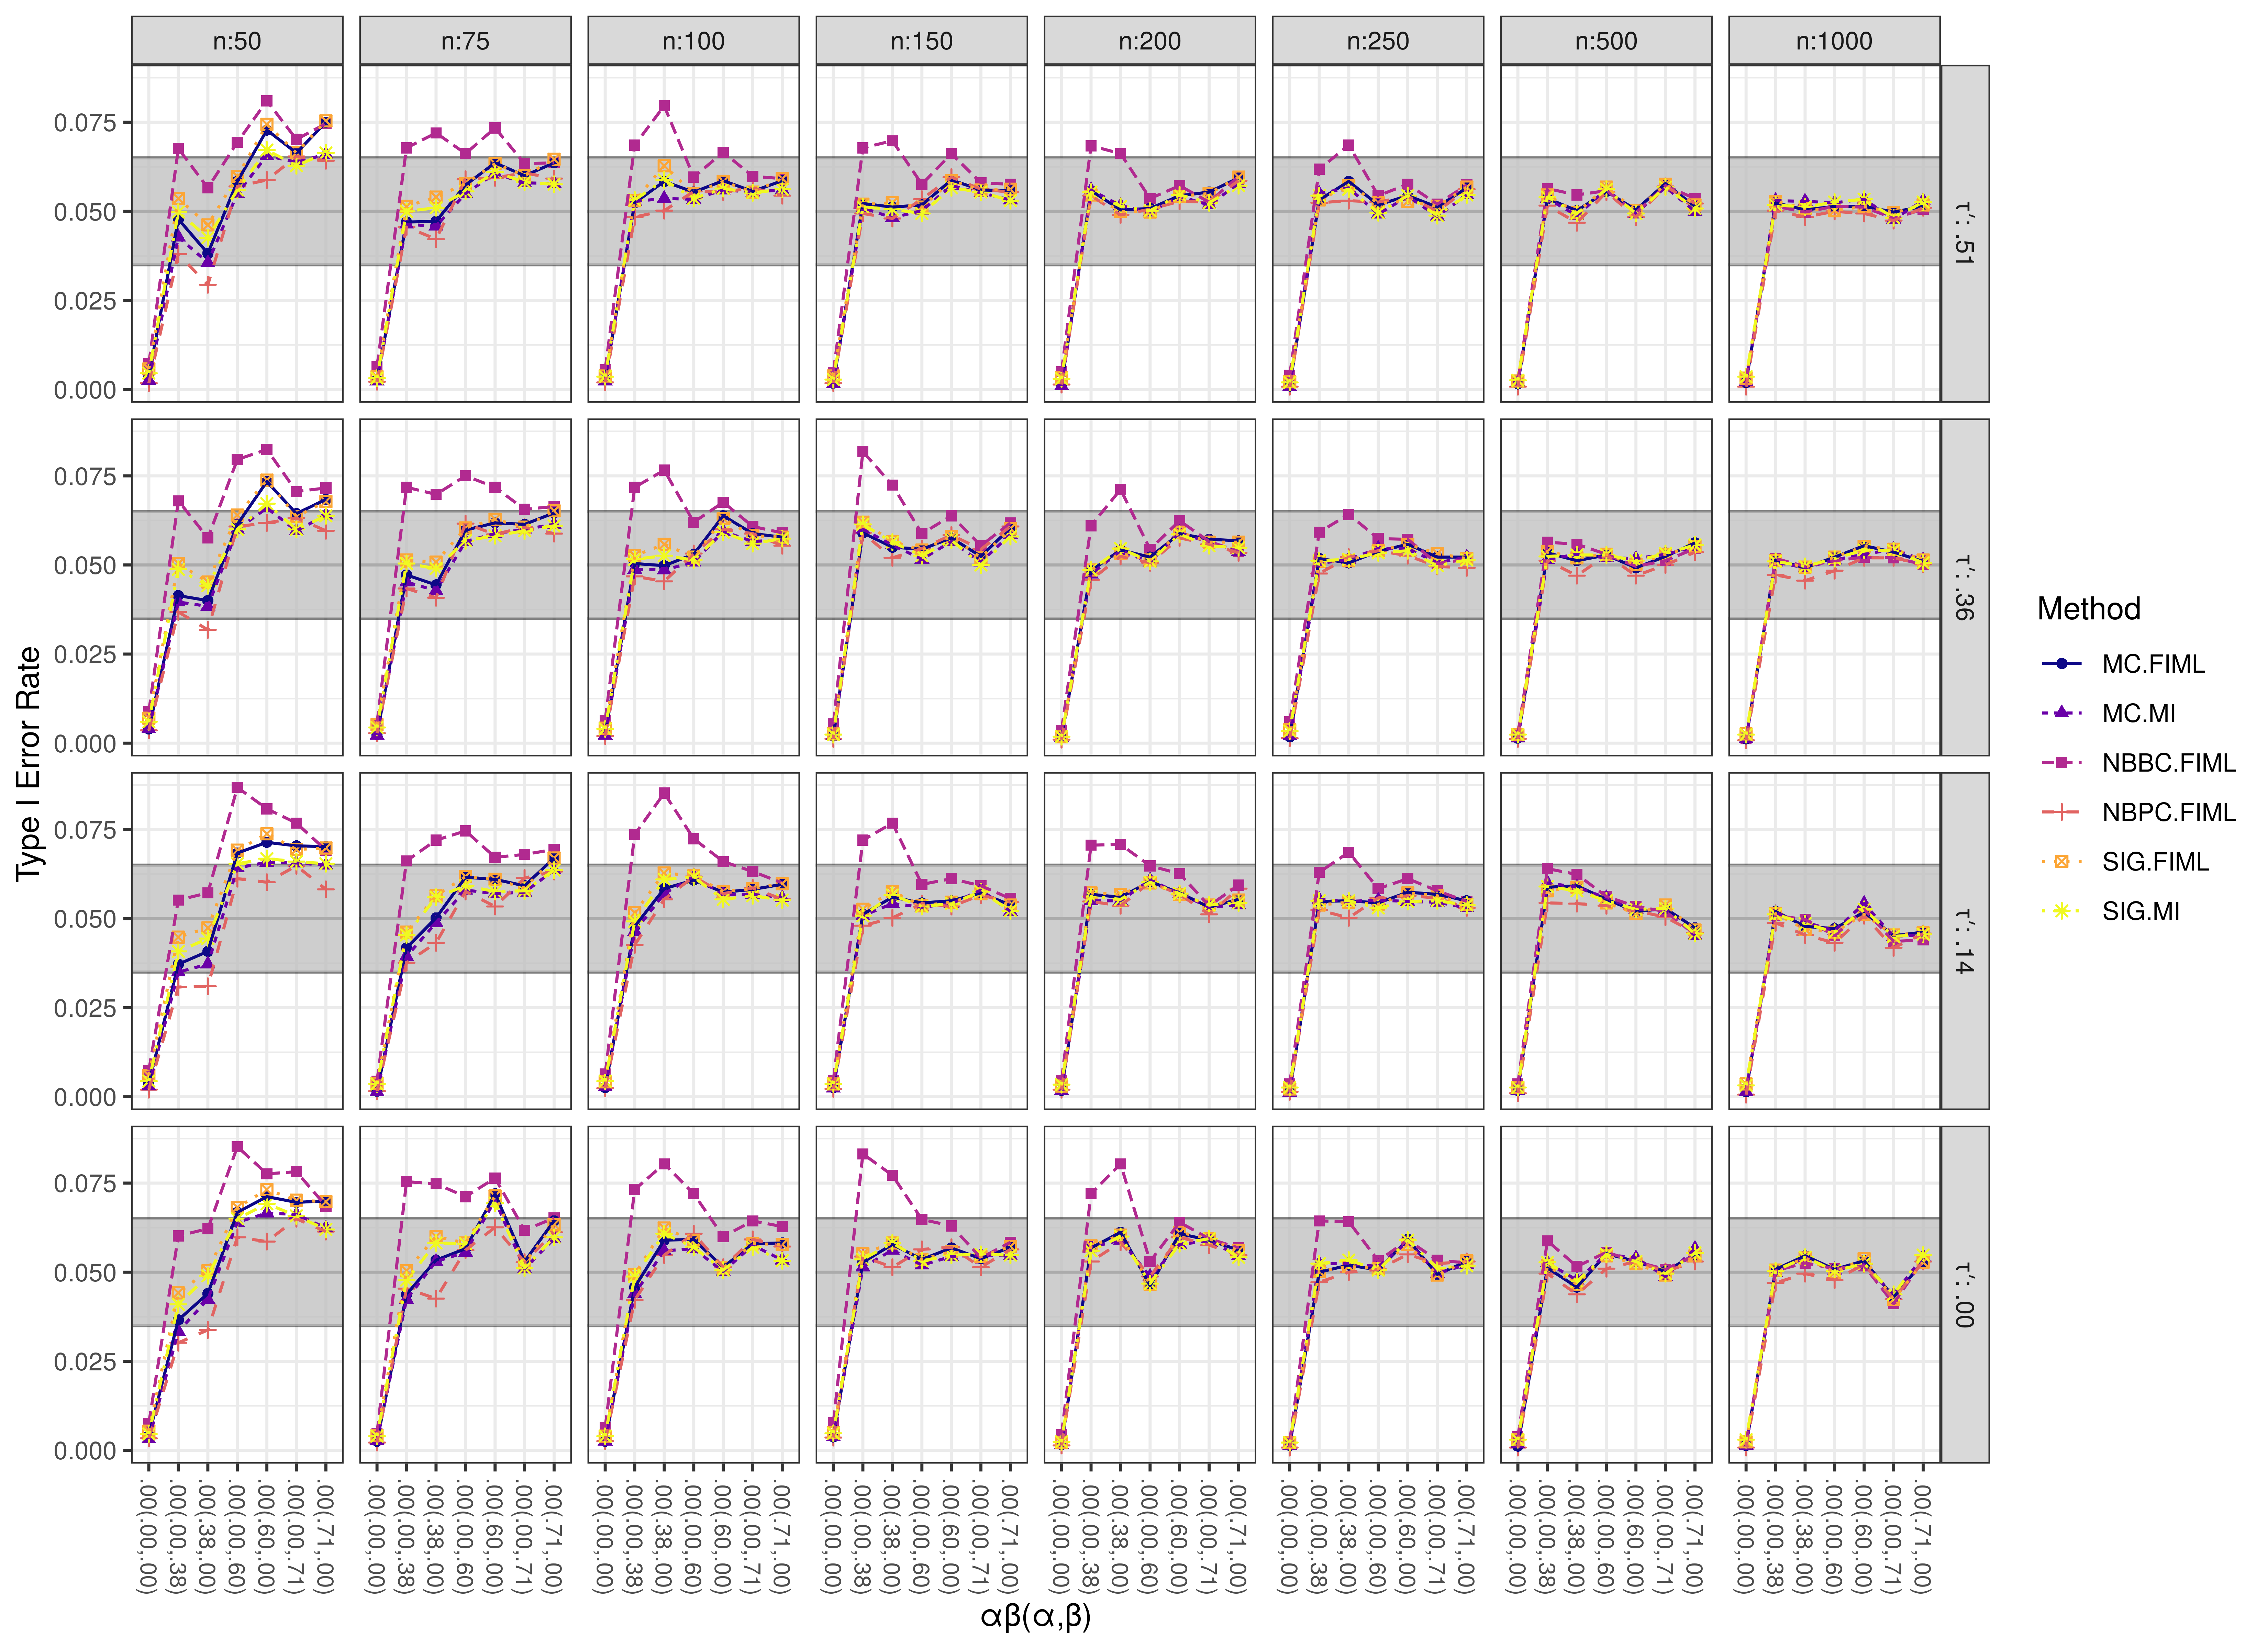
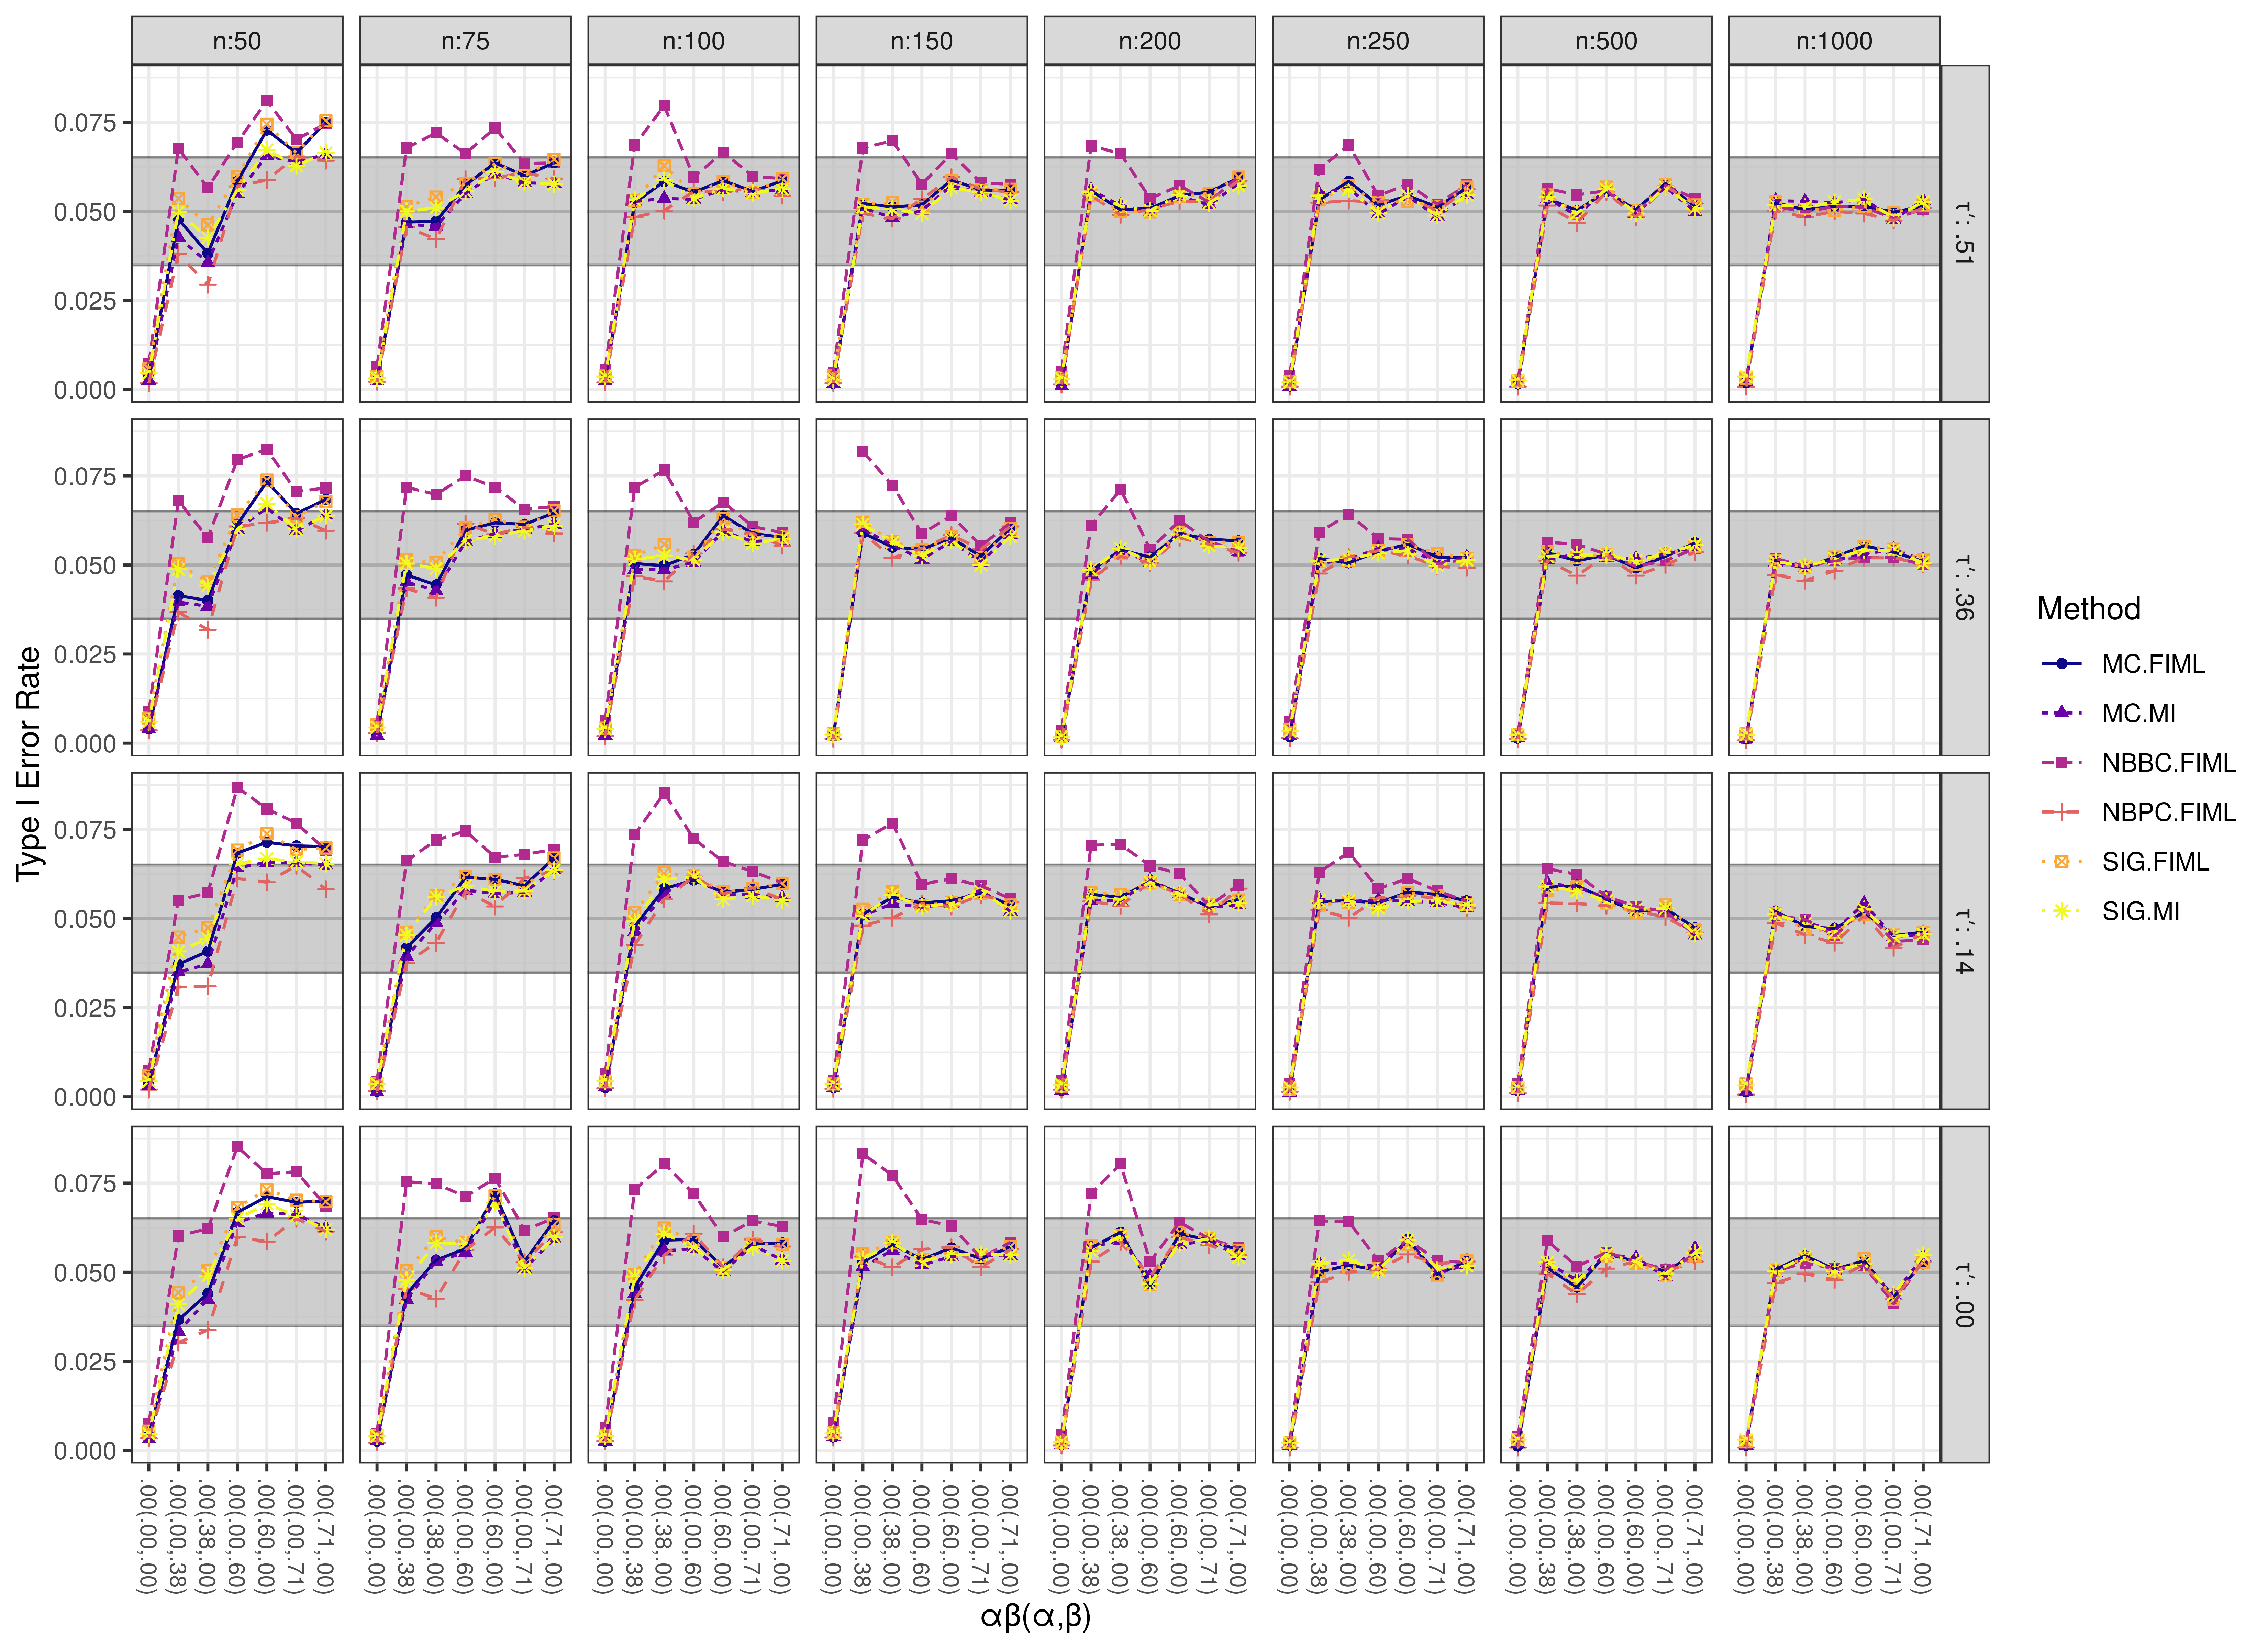
Type I Error Rate (Mechanism = COMPLETE)
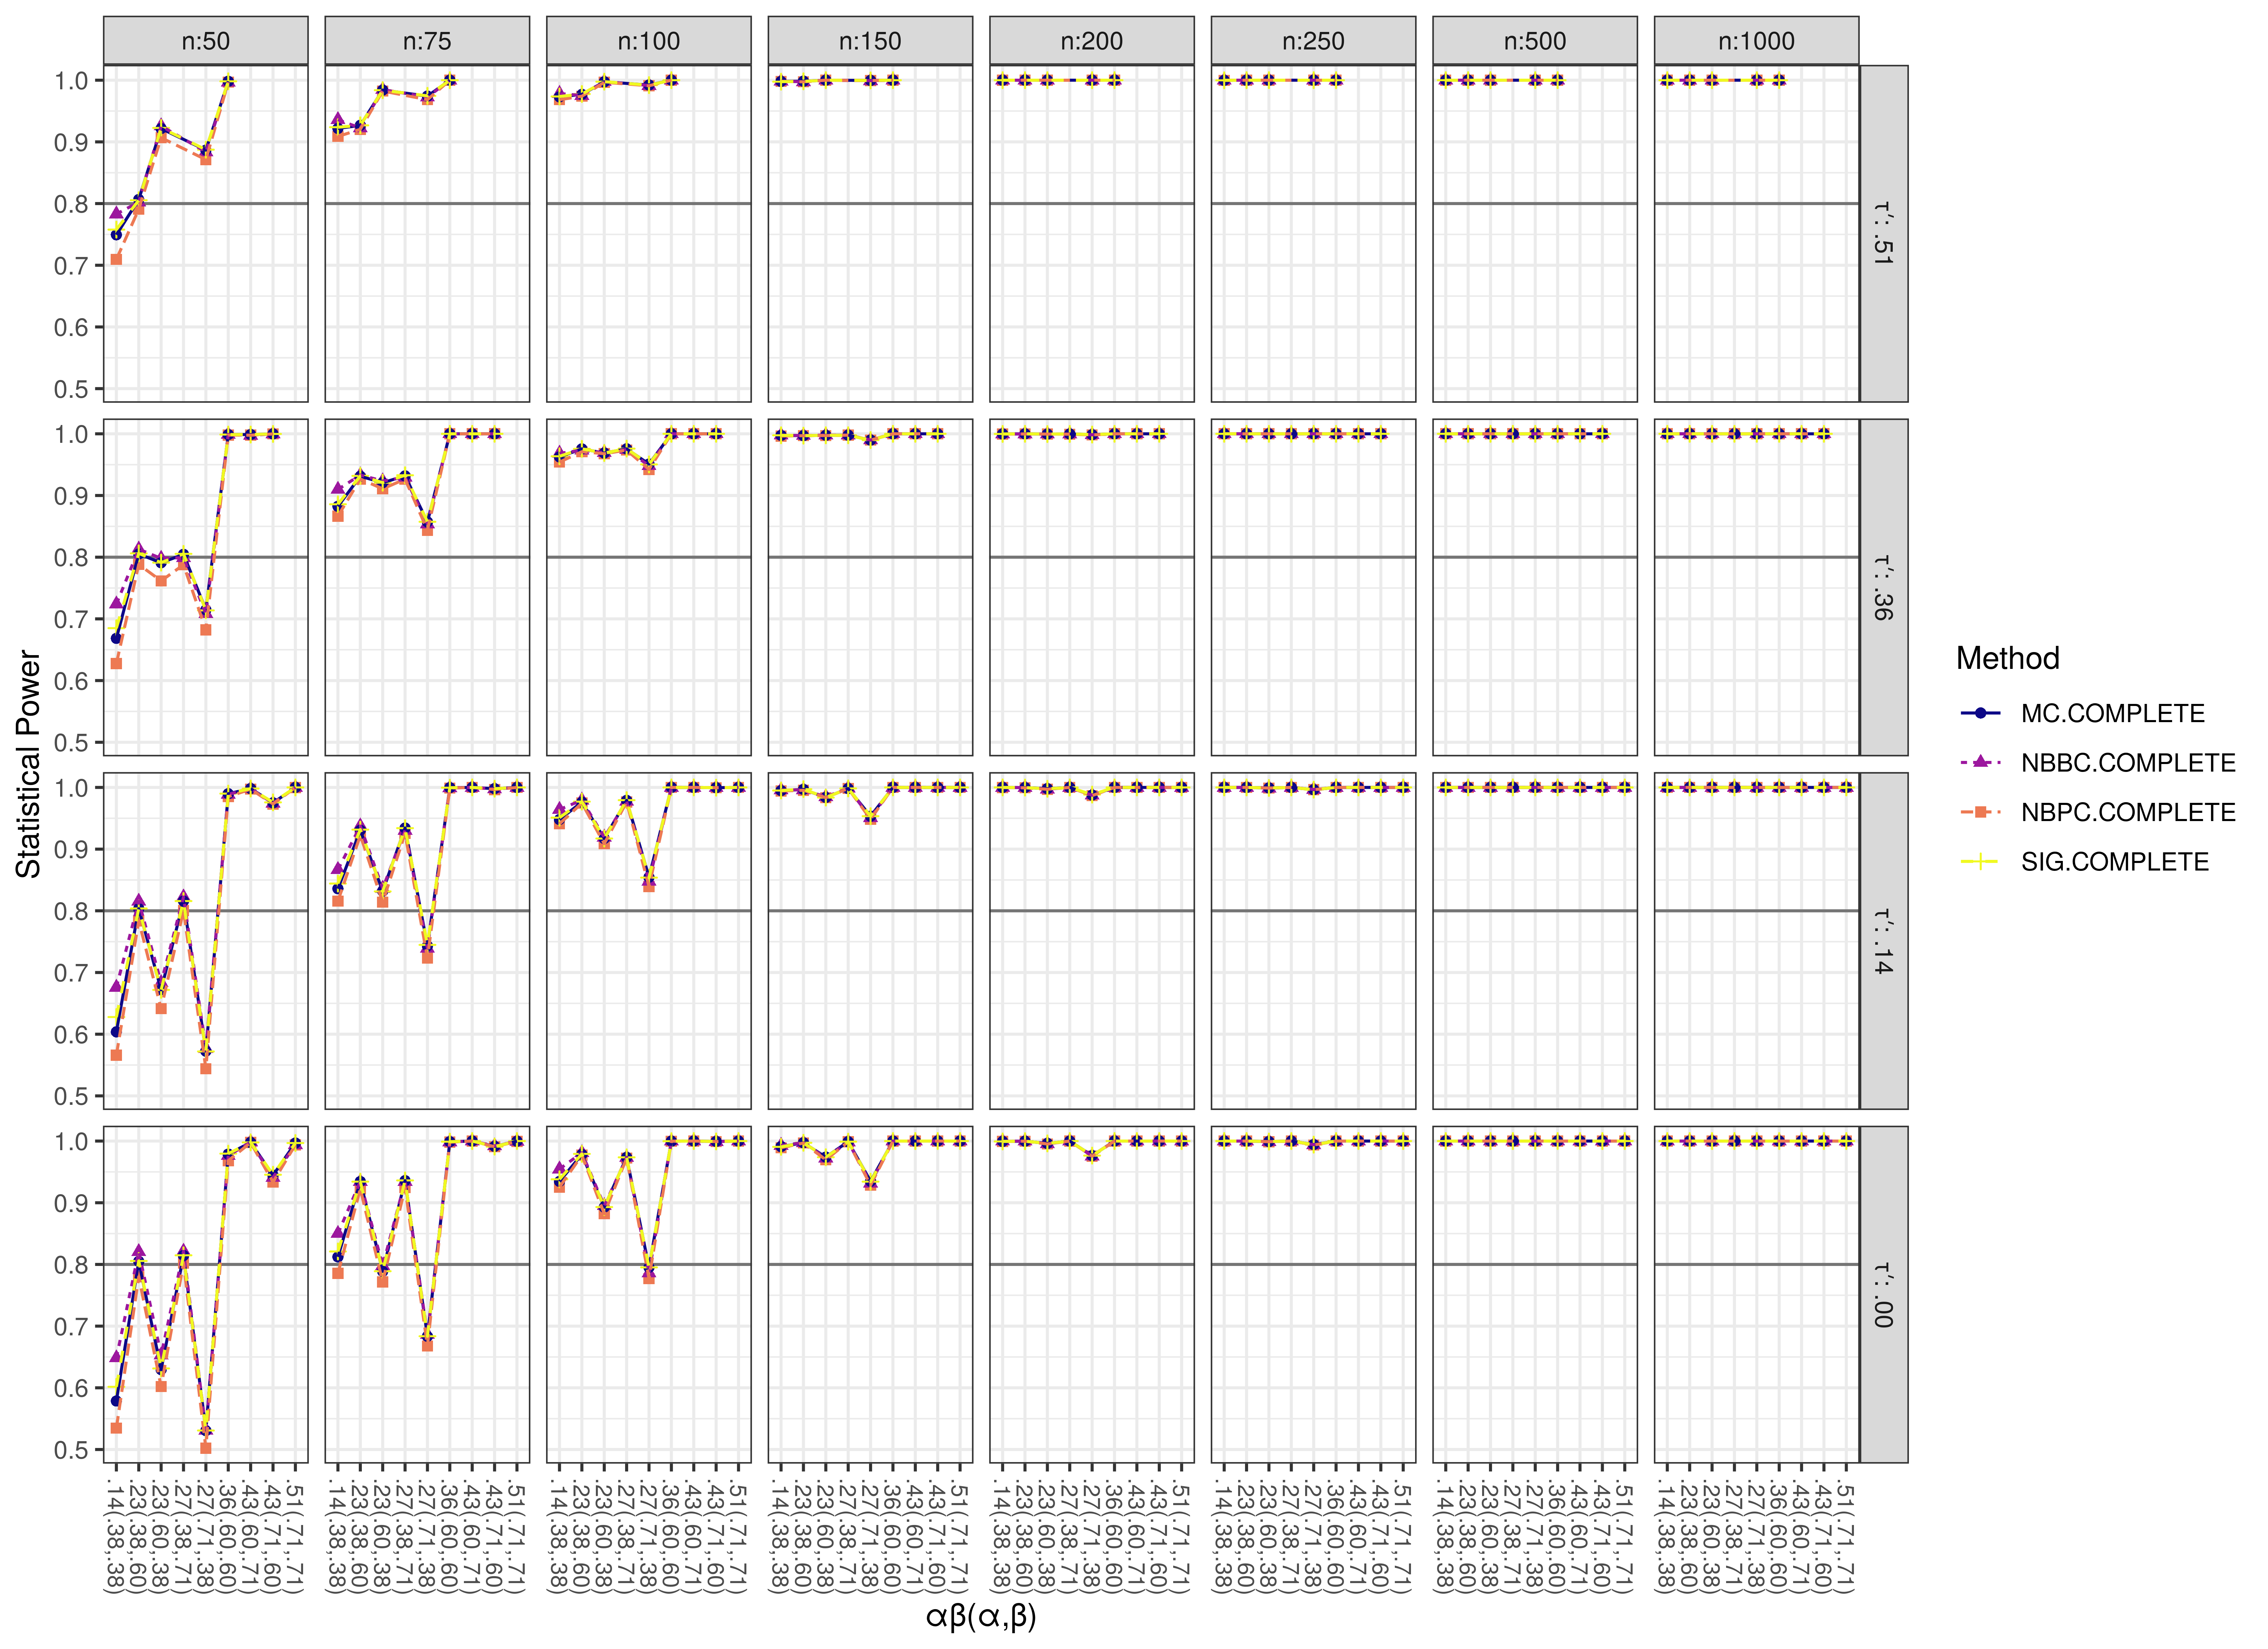
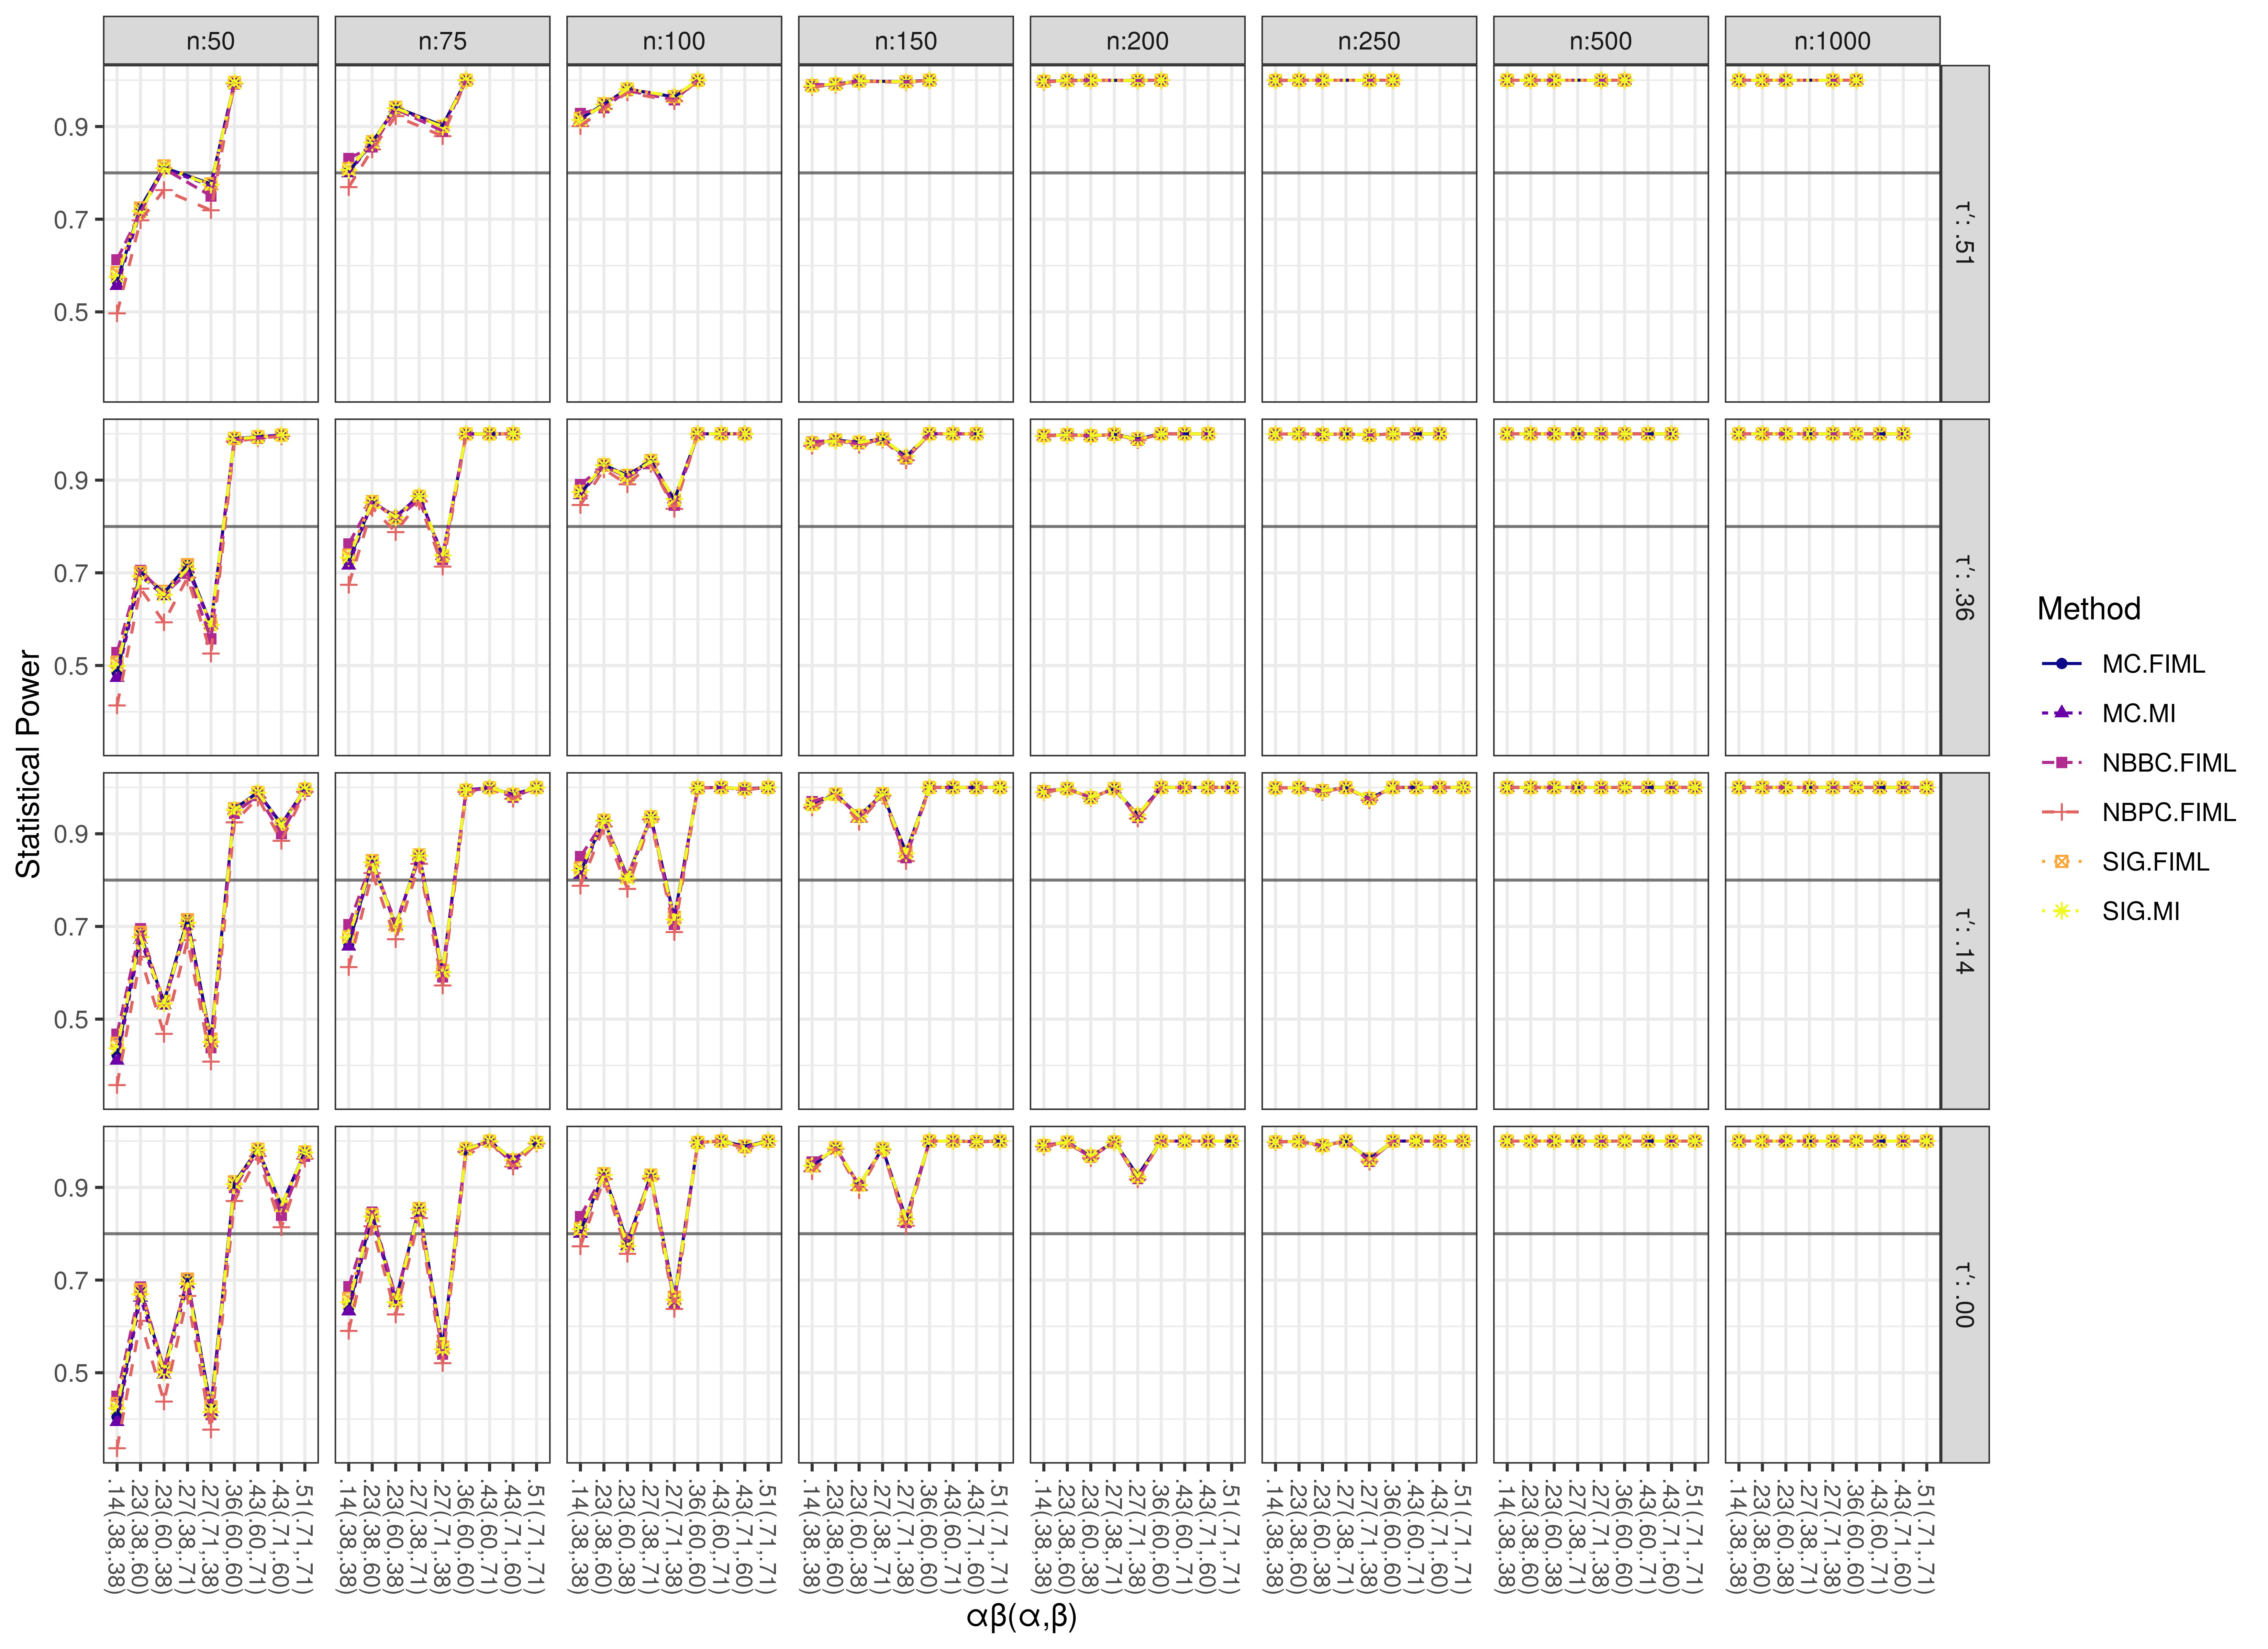
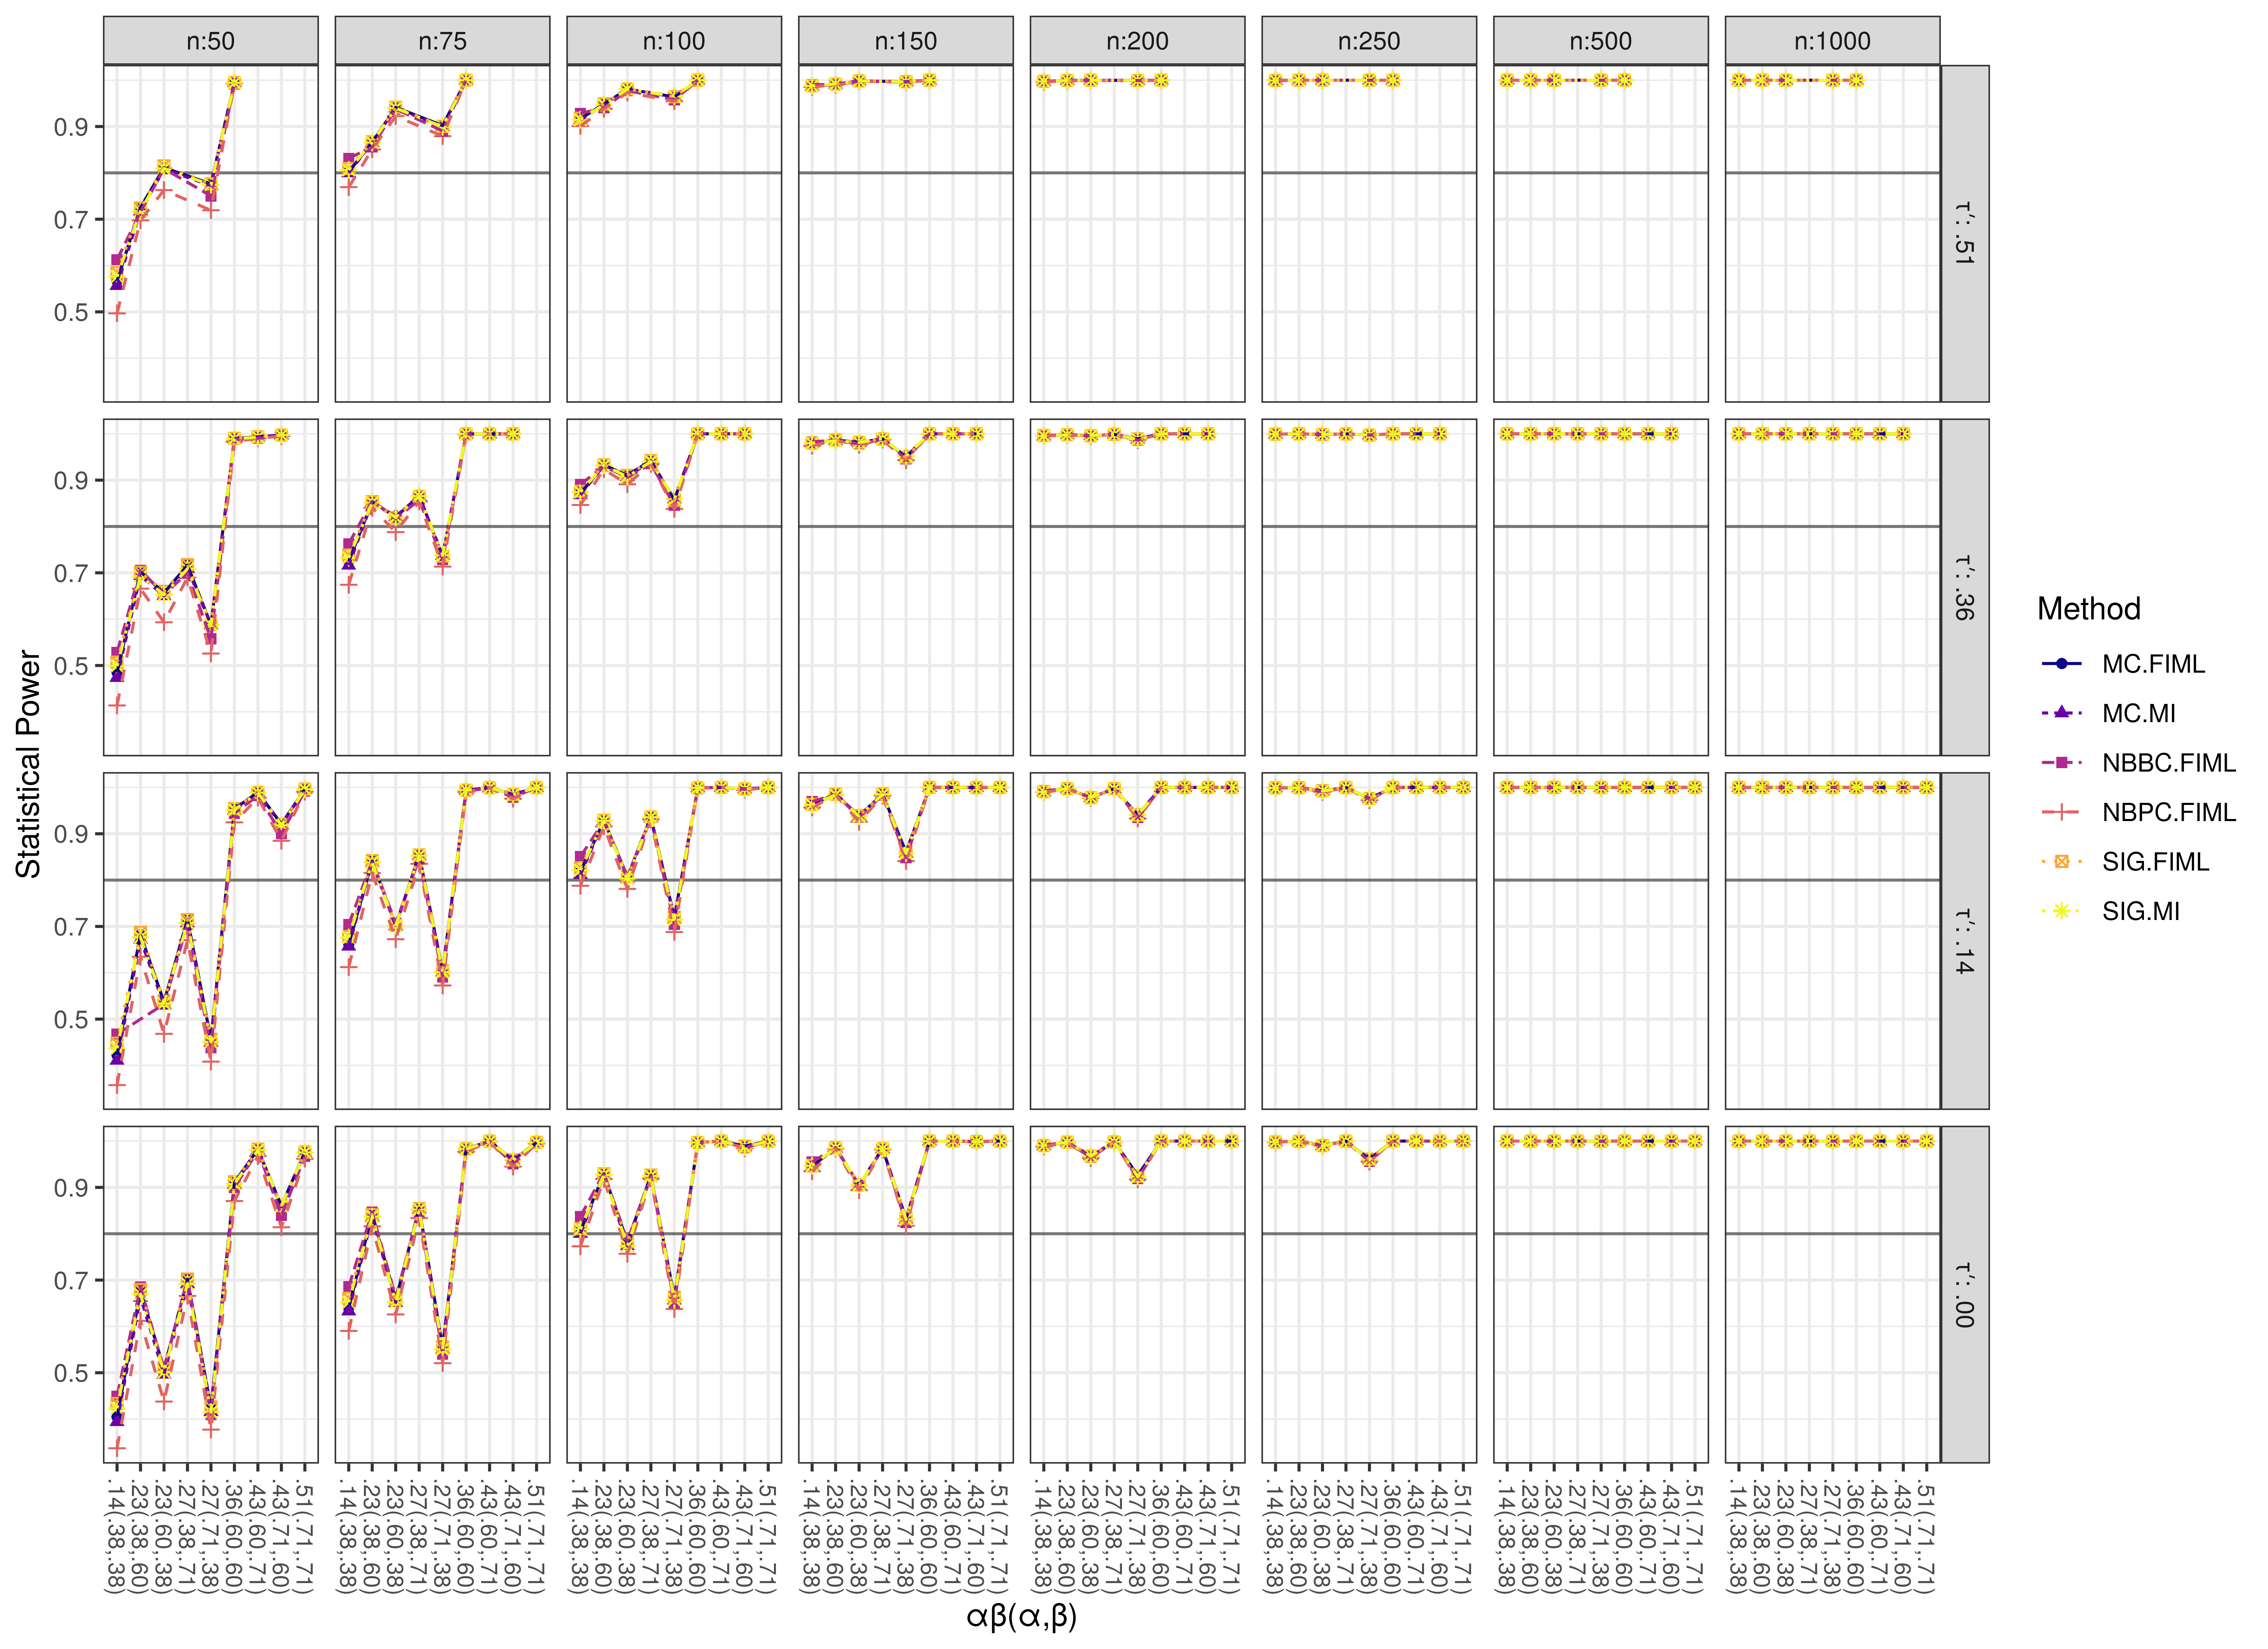
Statistical Power (Mechanism = COMPLETE)
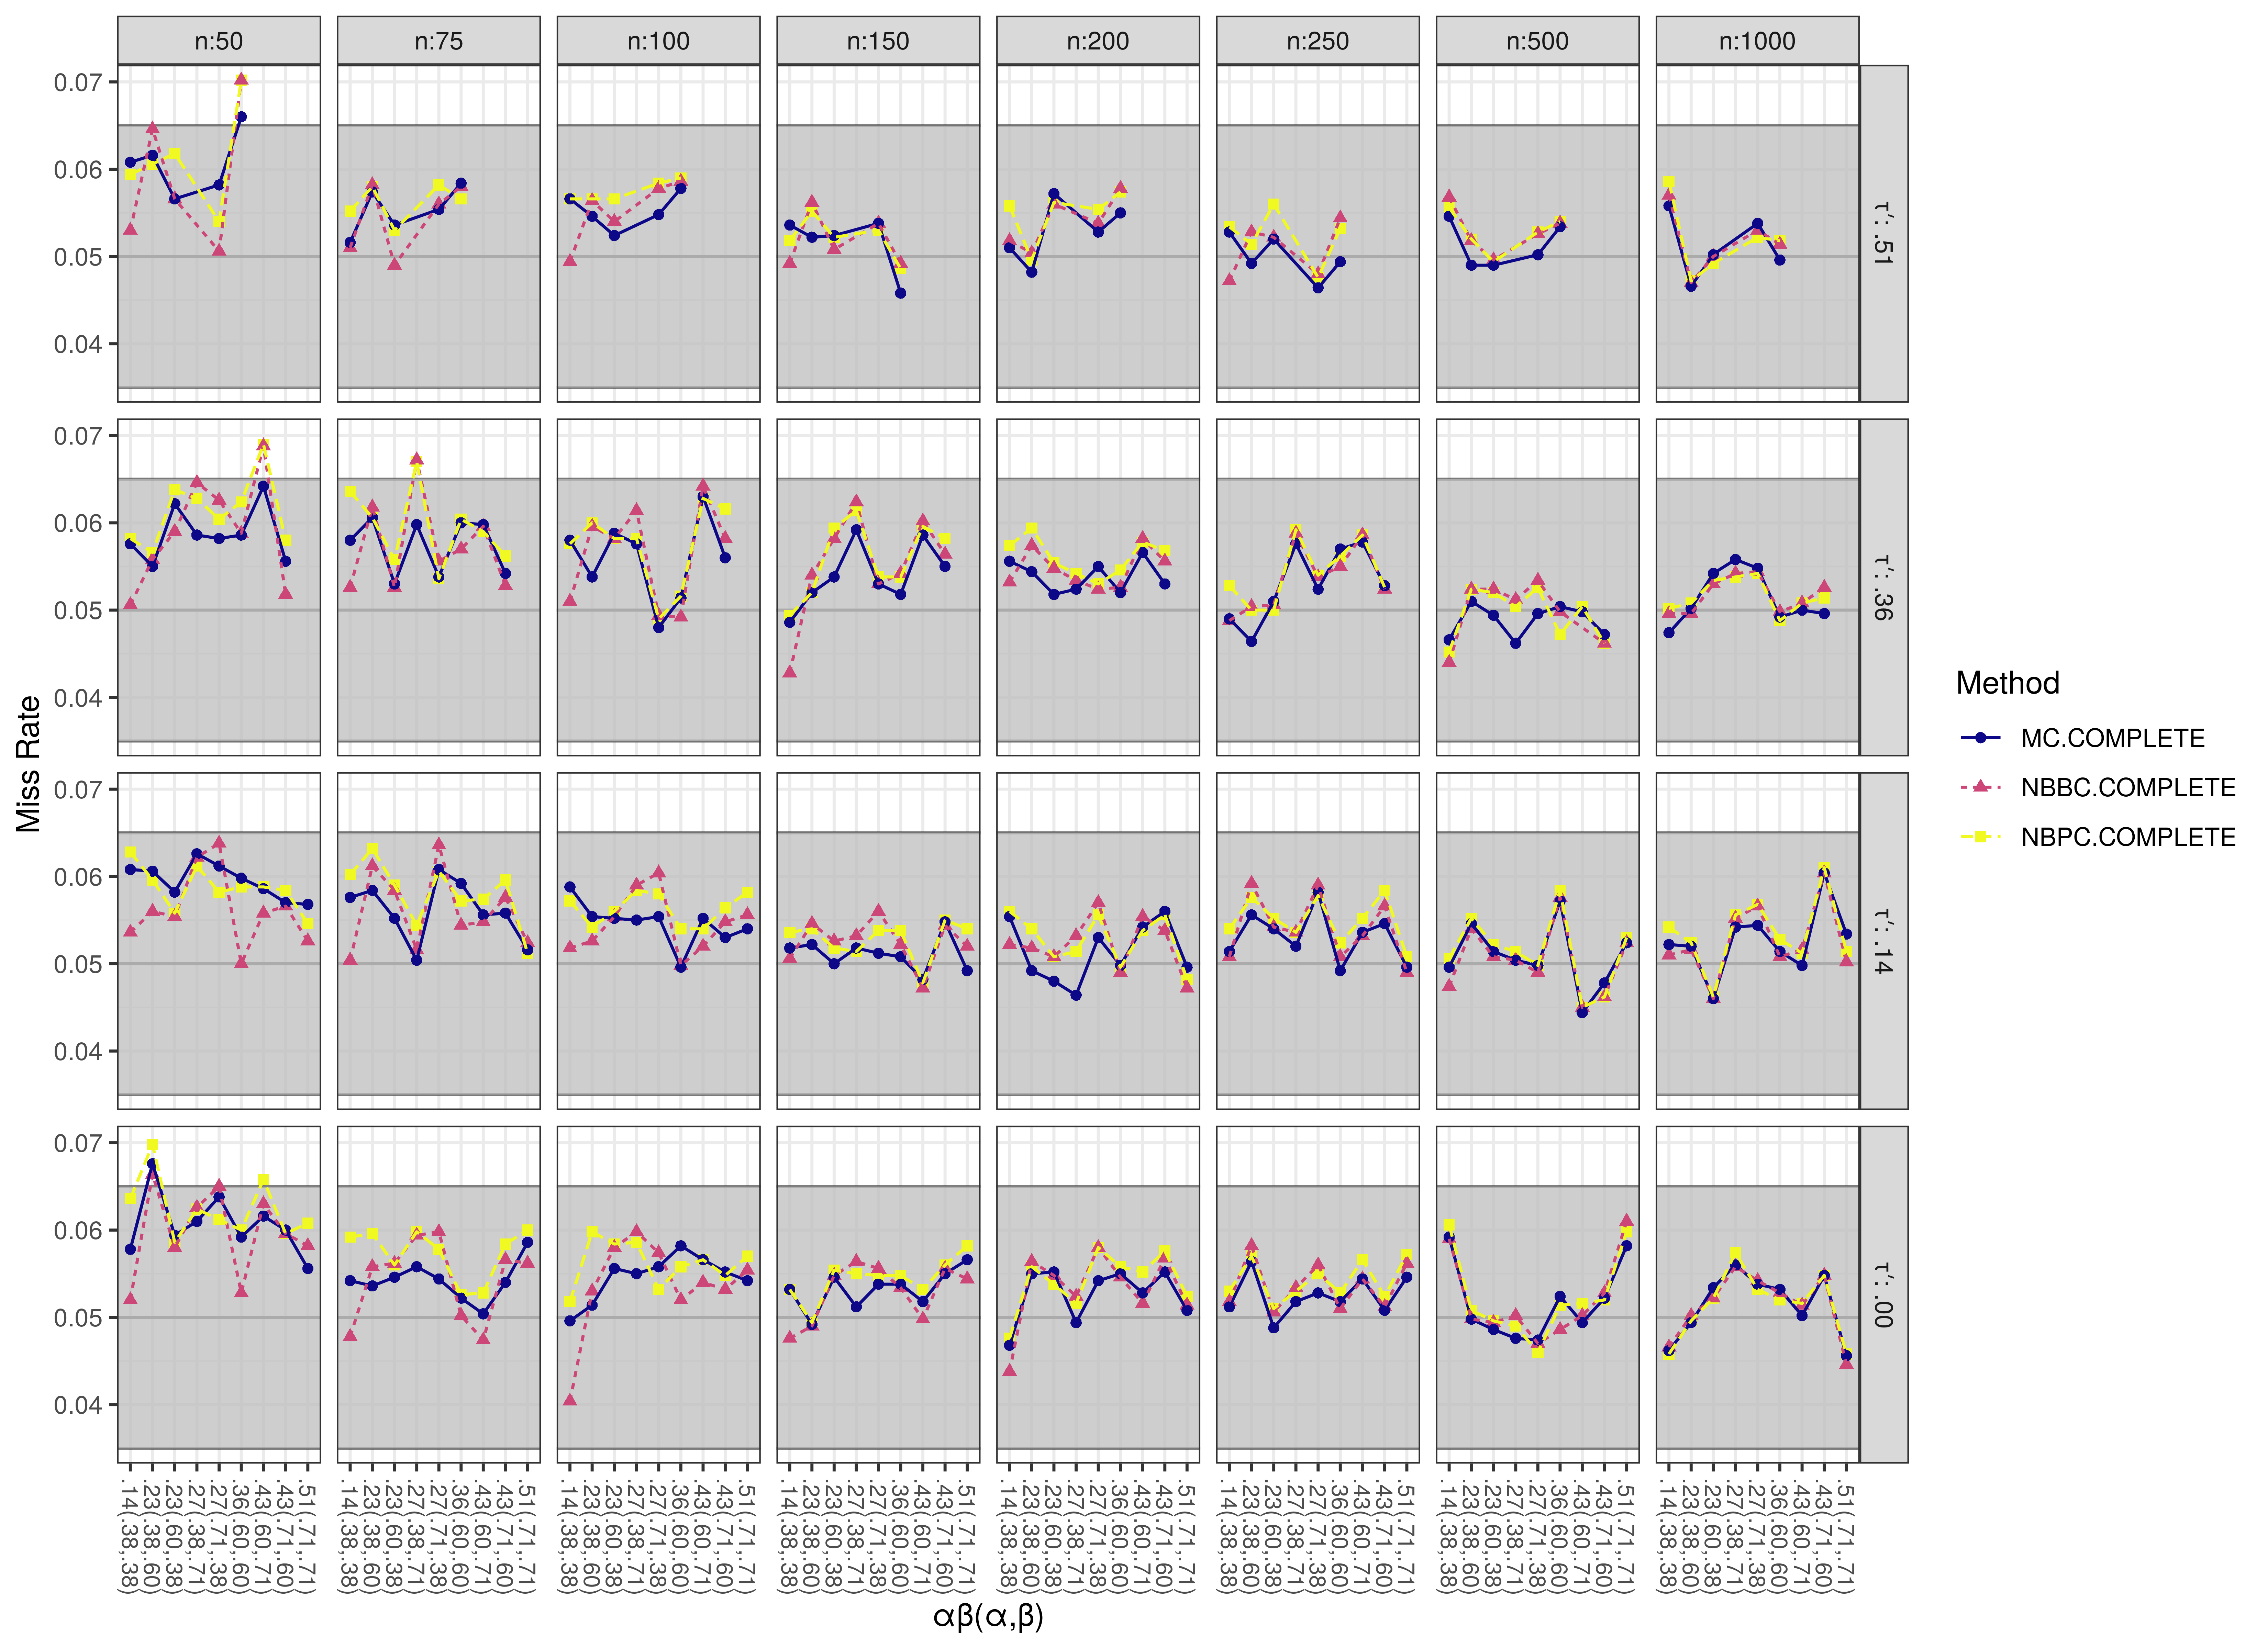
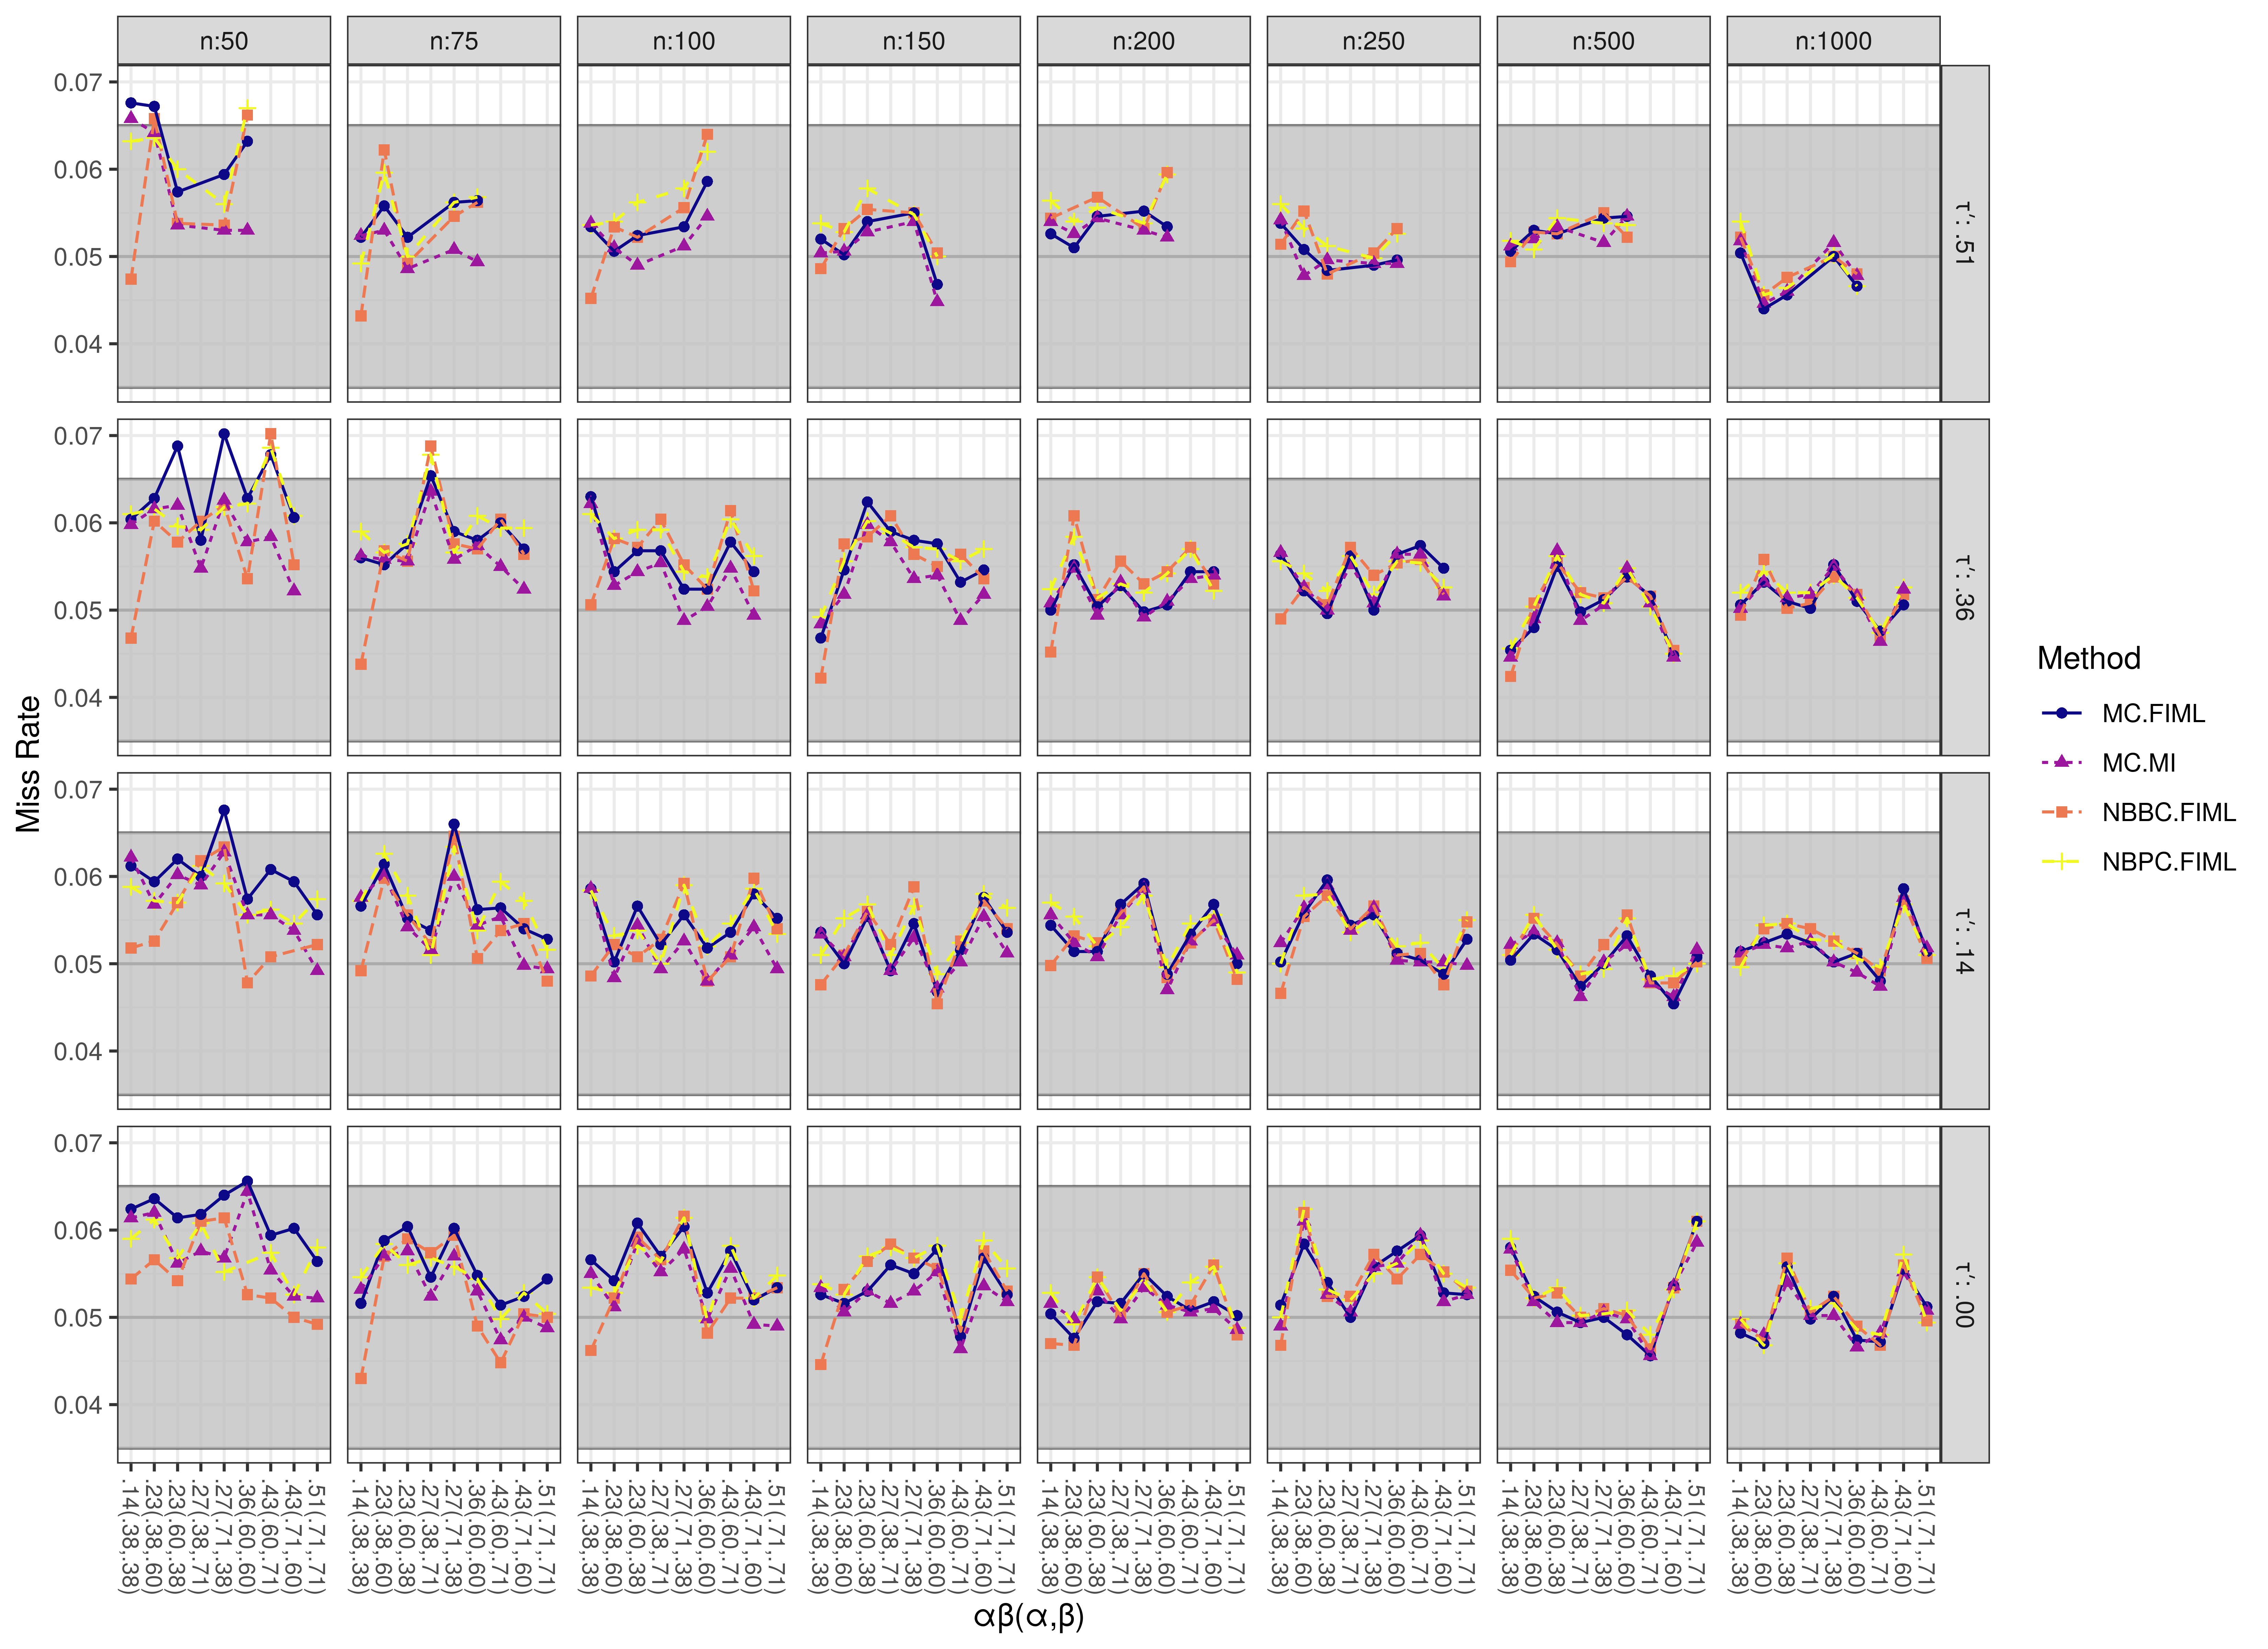
Miss Rate (Mechanism = COMPLETE)
Missing Completely at Random (MCAR)
Type I Error Rate (Mechanism = MCAR, Proportion = 0.1)

Statistical Power (Mechanism = MCAR, Proportion = 0.1)

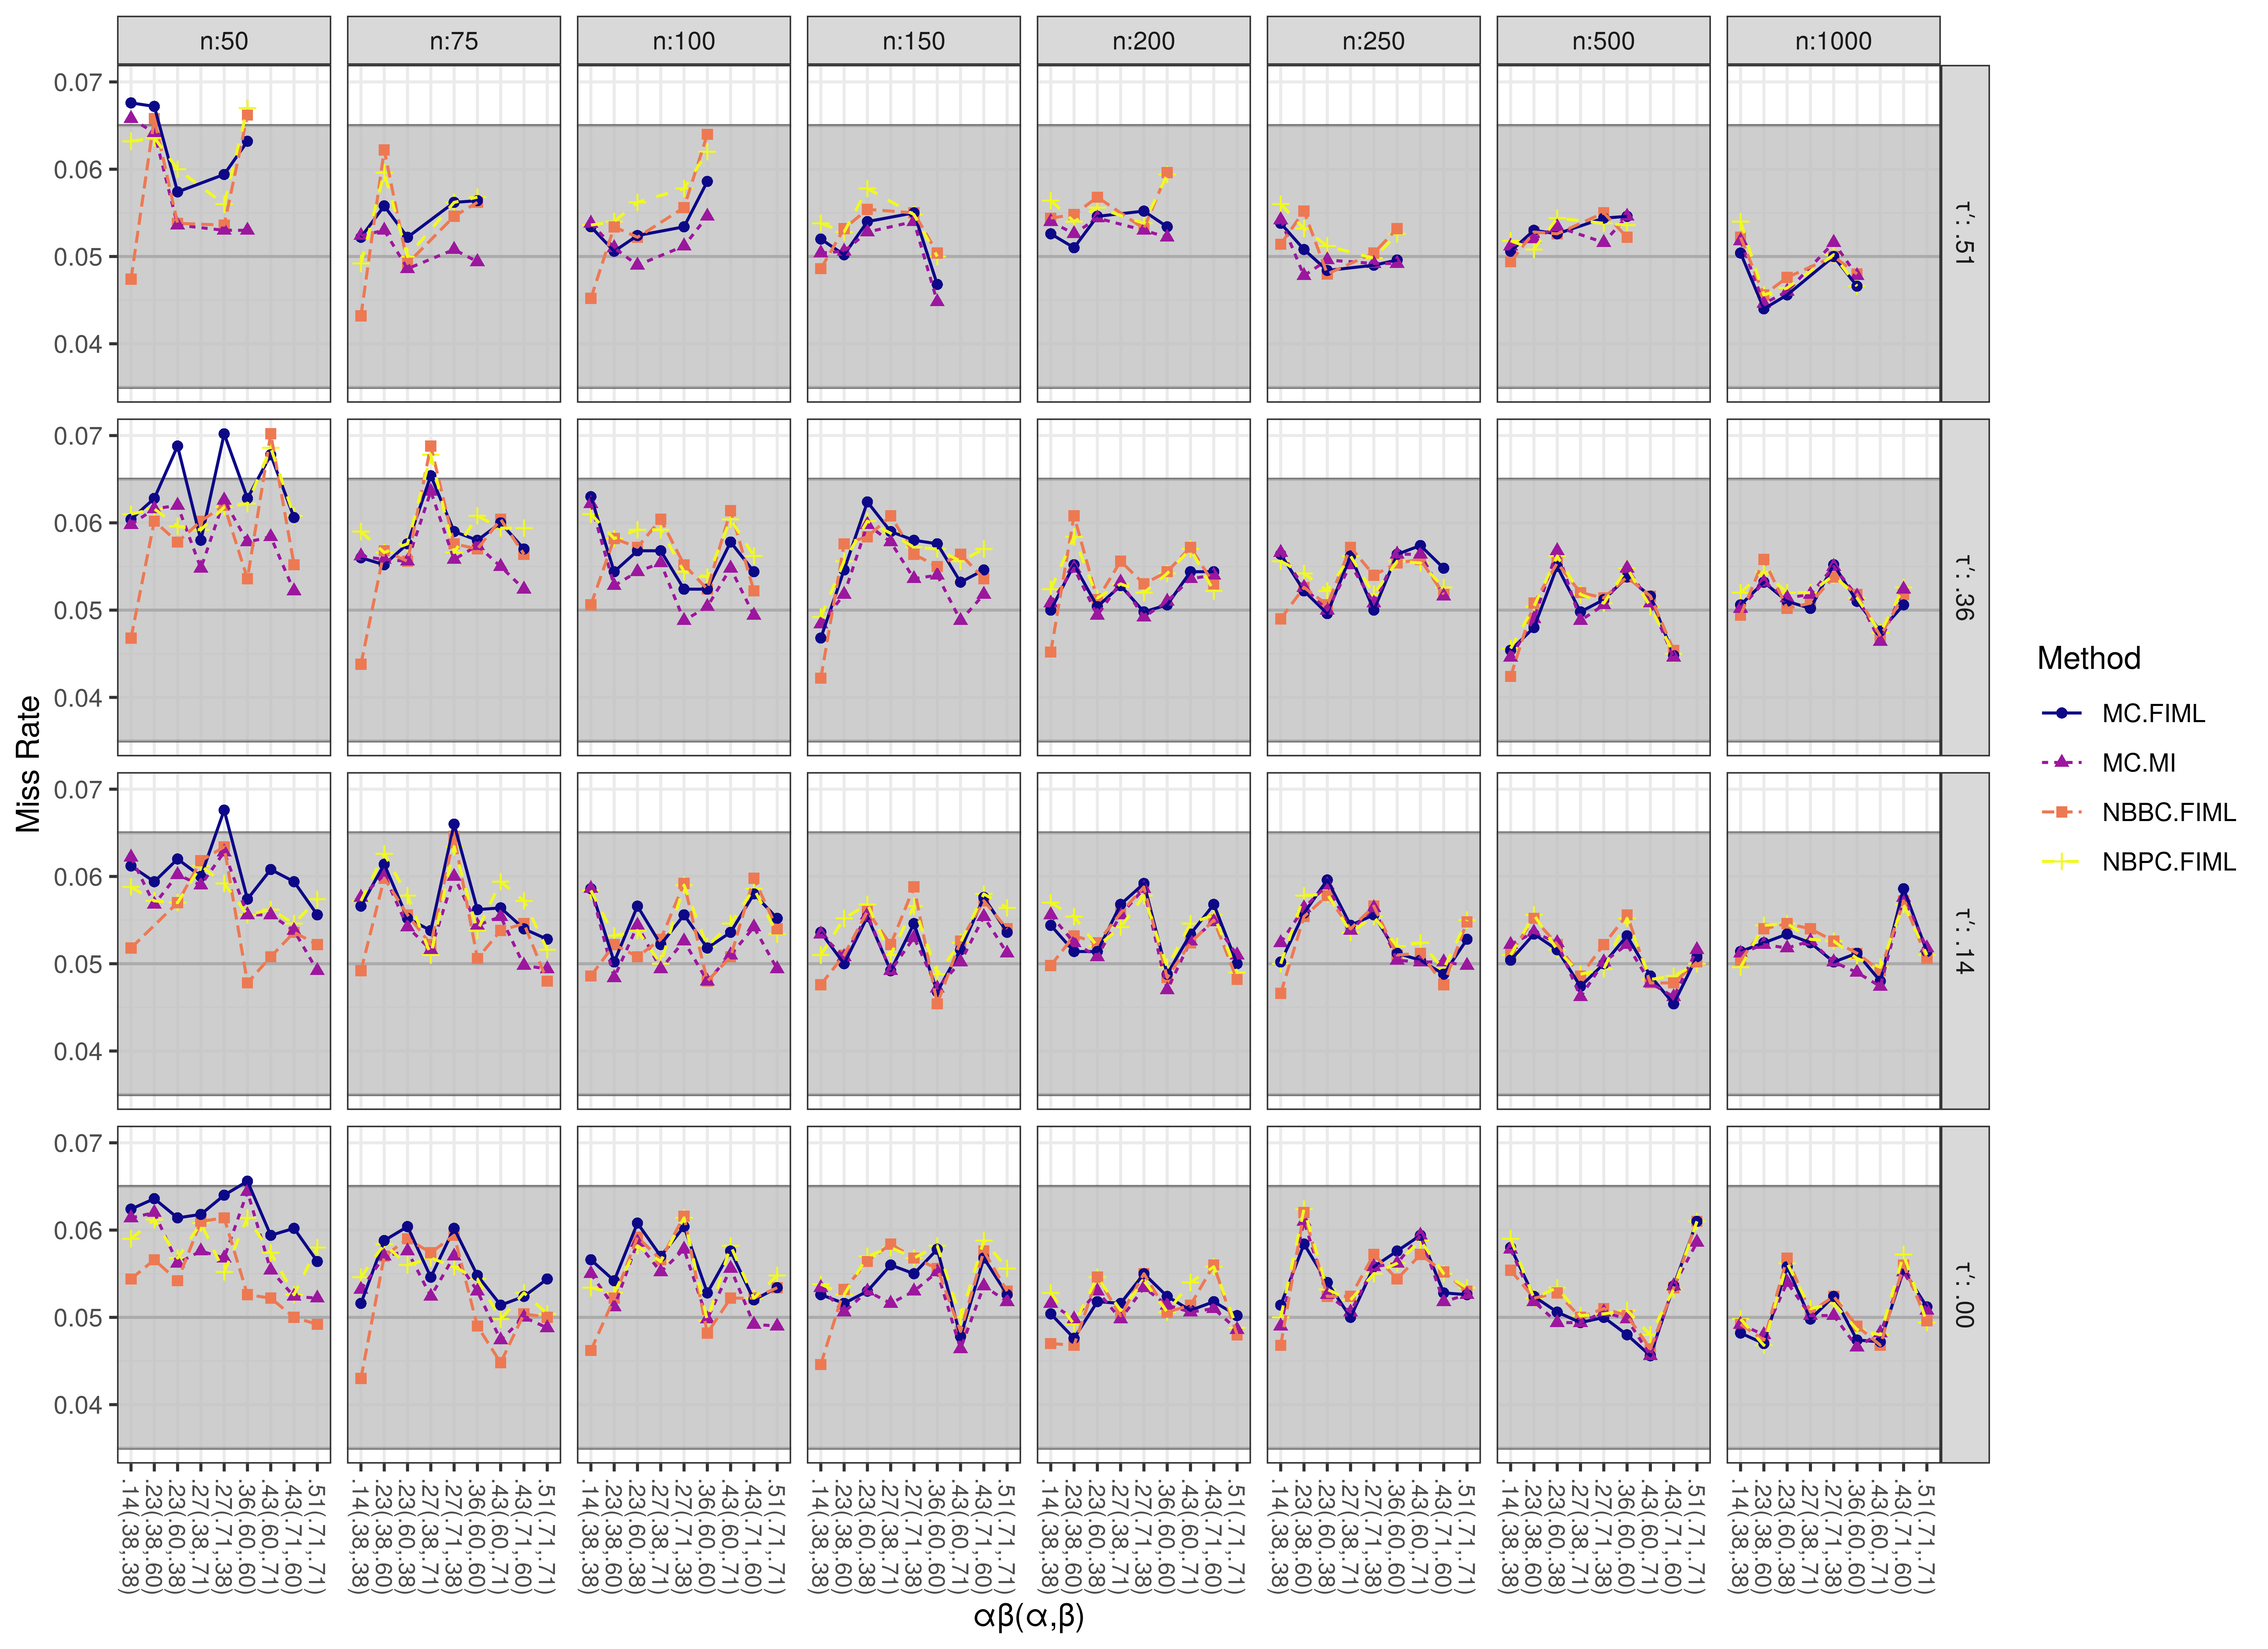
Miss Rate (Mechanism = MCAR, Proportion = 0.1)

Type I Error Rate (Mechanism = MCAR, Proportion = 0.2)
Statistical Power (Mechanism = MCAR, Proportion = 0.2)

Miss Rate (Mechanism = MCAR, Proportion = 0.2)

Type I Error Rate (Mechanism = MCAR, Proportion = 0.3)

Statistical Power (Mechanism = MCAR, Proportion = 0.3)

Miss Rate (Mechanism = MCAR, Proportion = 0.3)
Missing at Random (MAR)
Type I Error Rate (Mechanism = MAR, Proportion = 0.1)

Statistical Power (Mechanism = MAR, Proportion = 0.1)

Miss Rate (Mechanism = MAR, Proportion = 0.1)

Type I Error Rate (Mechanism = MAR, Proportion = 0.2)

Statistical Power (Mechanism = MAR, Proportion = 0.2)
Miss Rate (Mechanism = MAR, Proportion = 0.2)

Type I Error Rate (Mechanism = MAR, Proportion = 0.3)
Statistical Power (Mechanism = MAR, Proportion = 0.3)
Miss Rate (Mechanism = MAR, Proportion = 0.3)