Scatter Plots - CULTA Estimates
Ivan Jacob Agaloos Pesigan
Source:vignettes/fig-culta.Rmd
fig-culta.RmdBias
data(results_culta_est, package = "manCULTA")
FigBiasCULTAEst(results_culta_est = results_culta_est)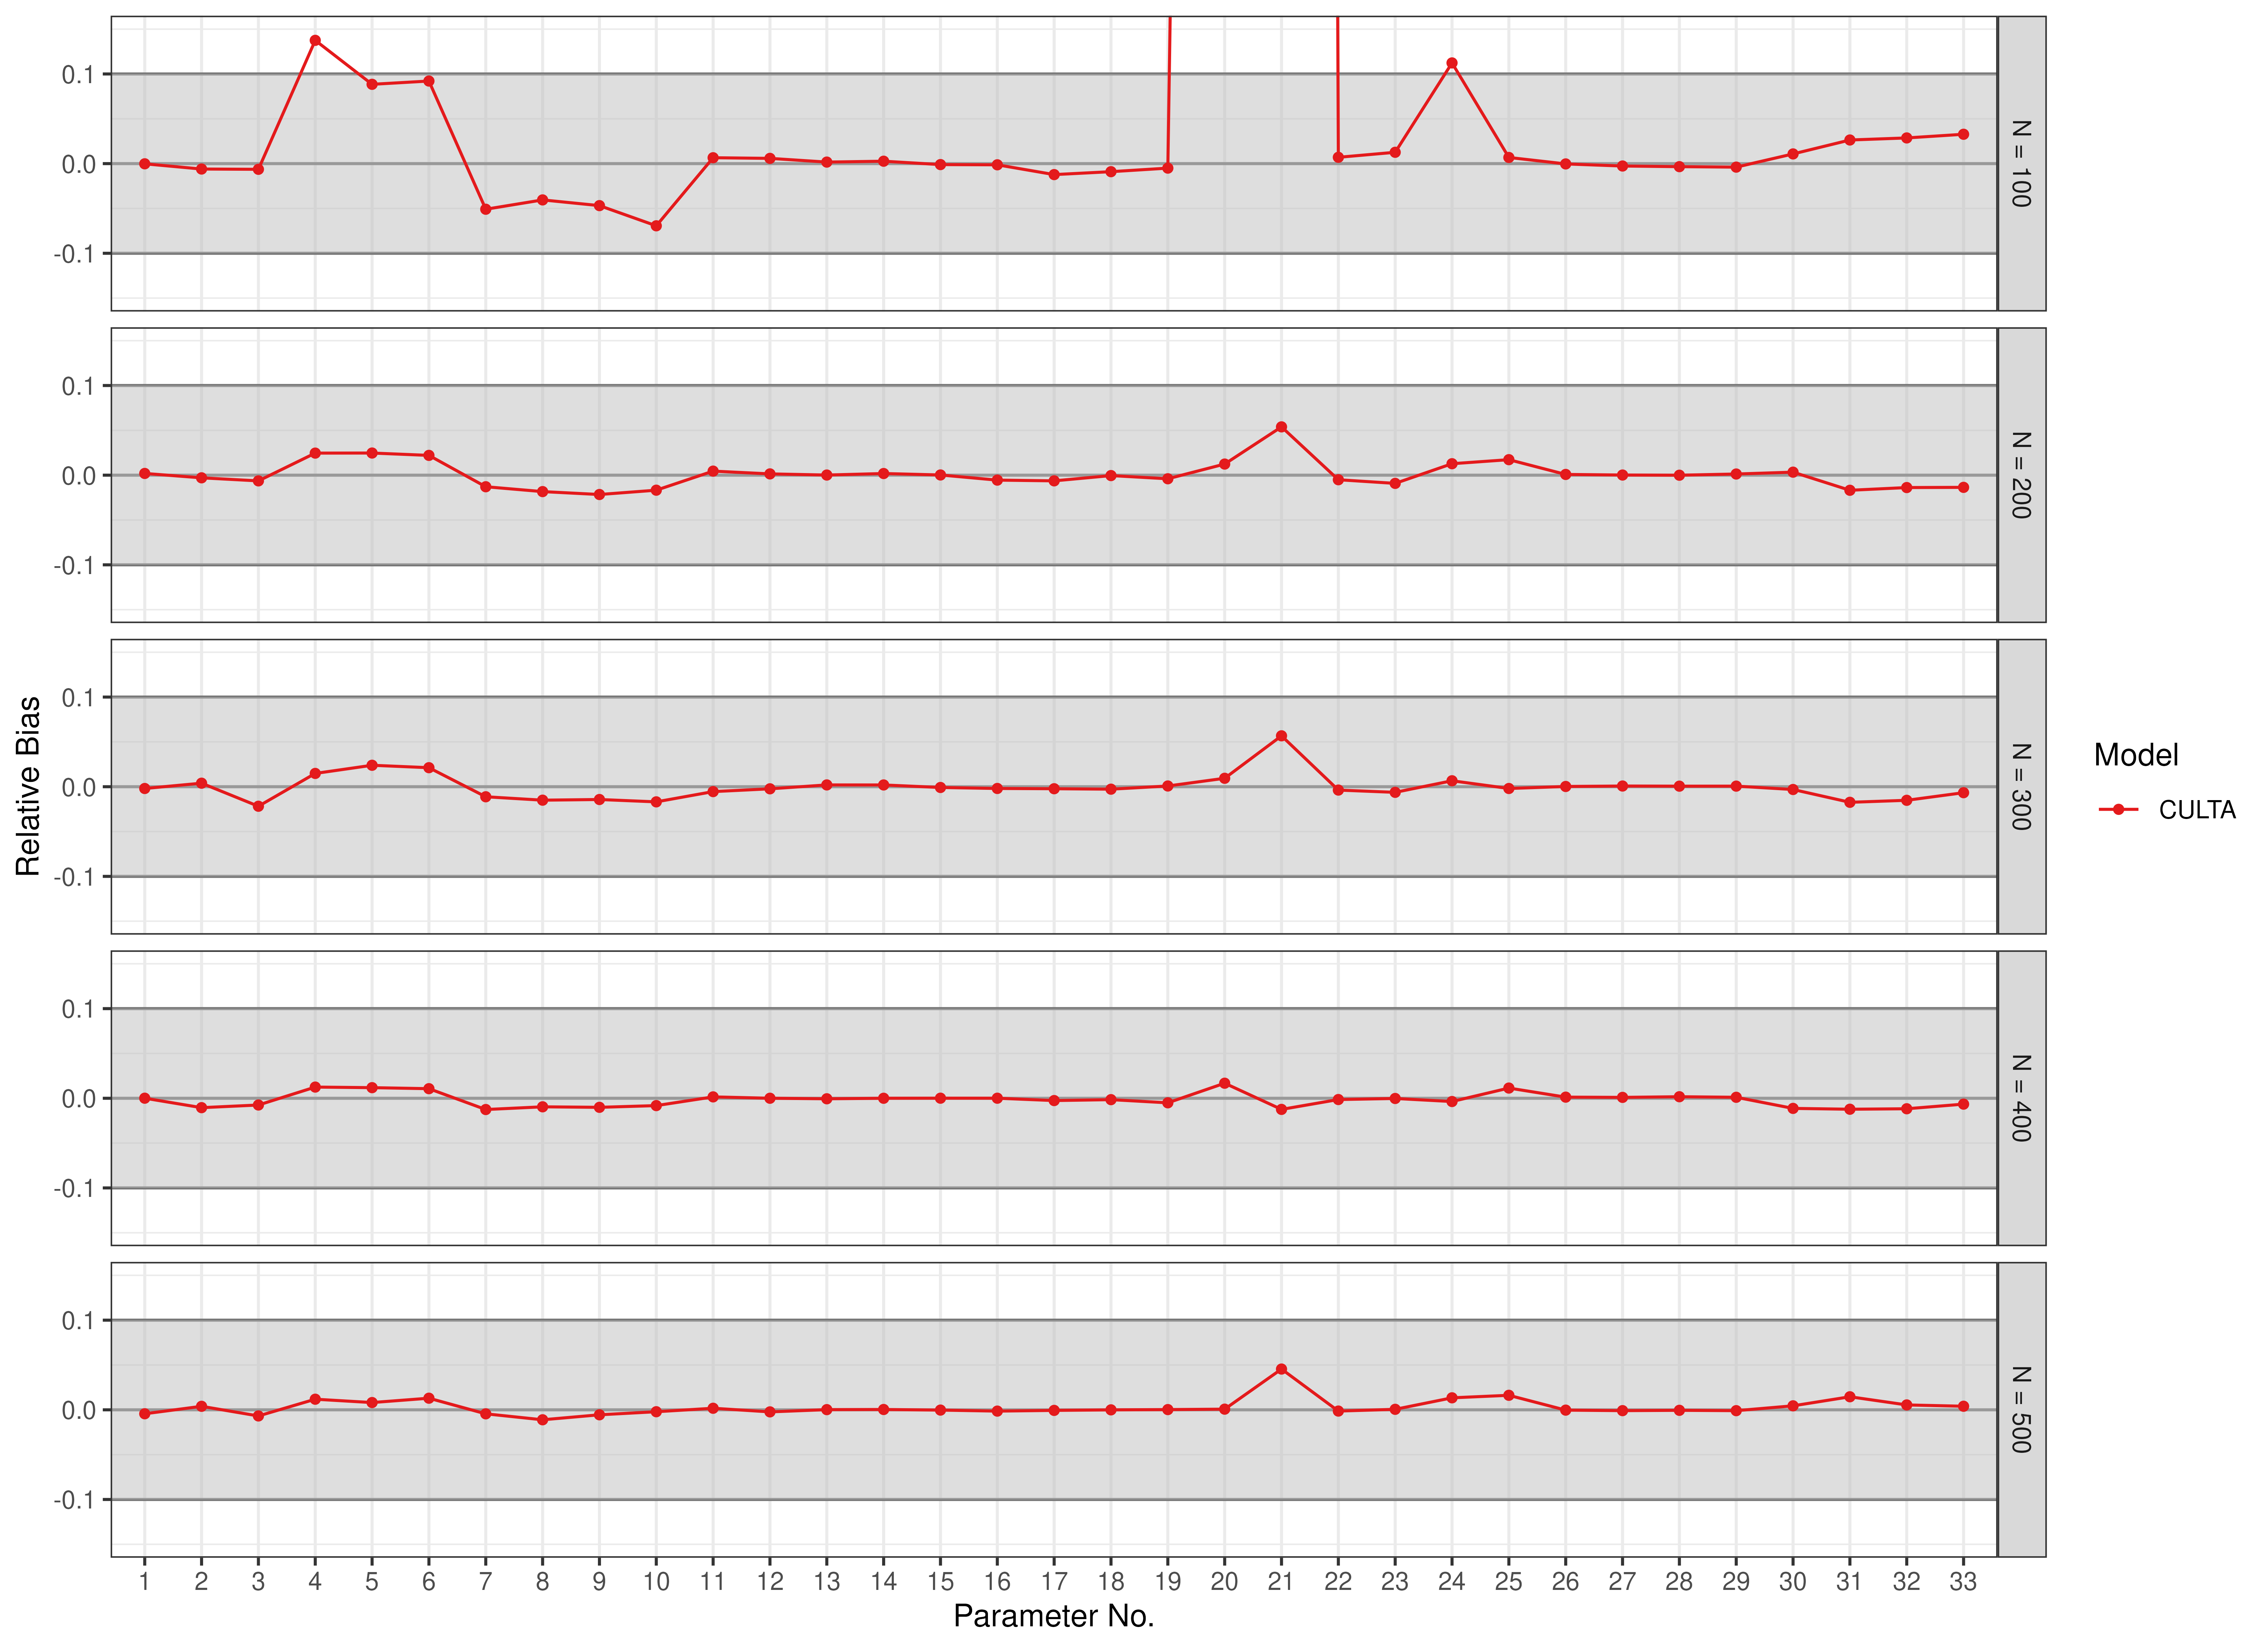
Root Mean Square Error (RMSE)
data(results_culta_est, package = "manCULTA")
FigRMSECULTAEst(results_culta_est = results_culta_est)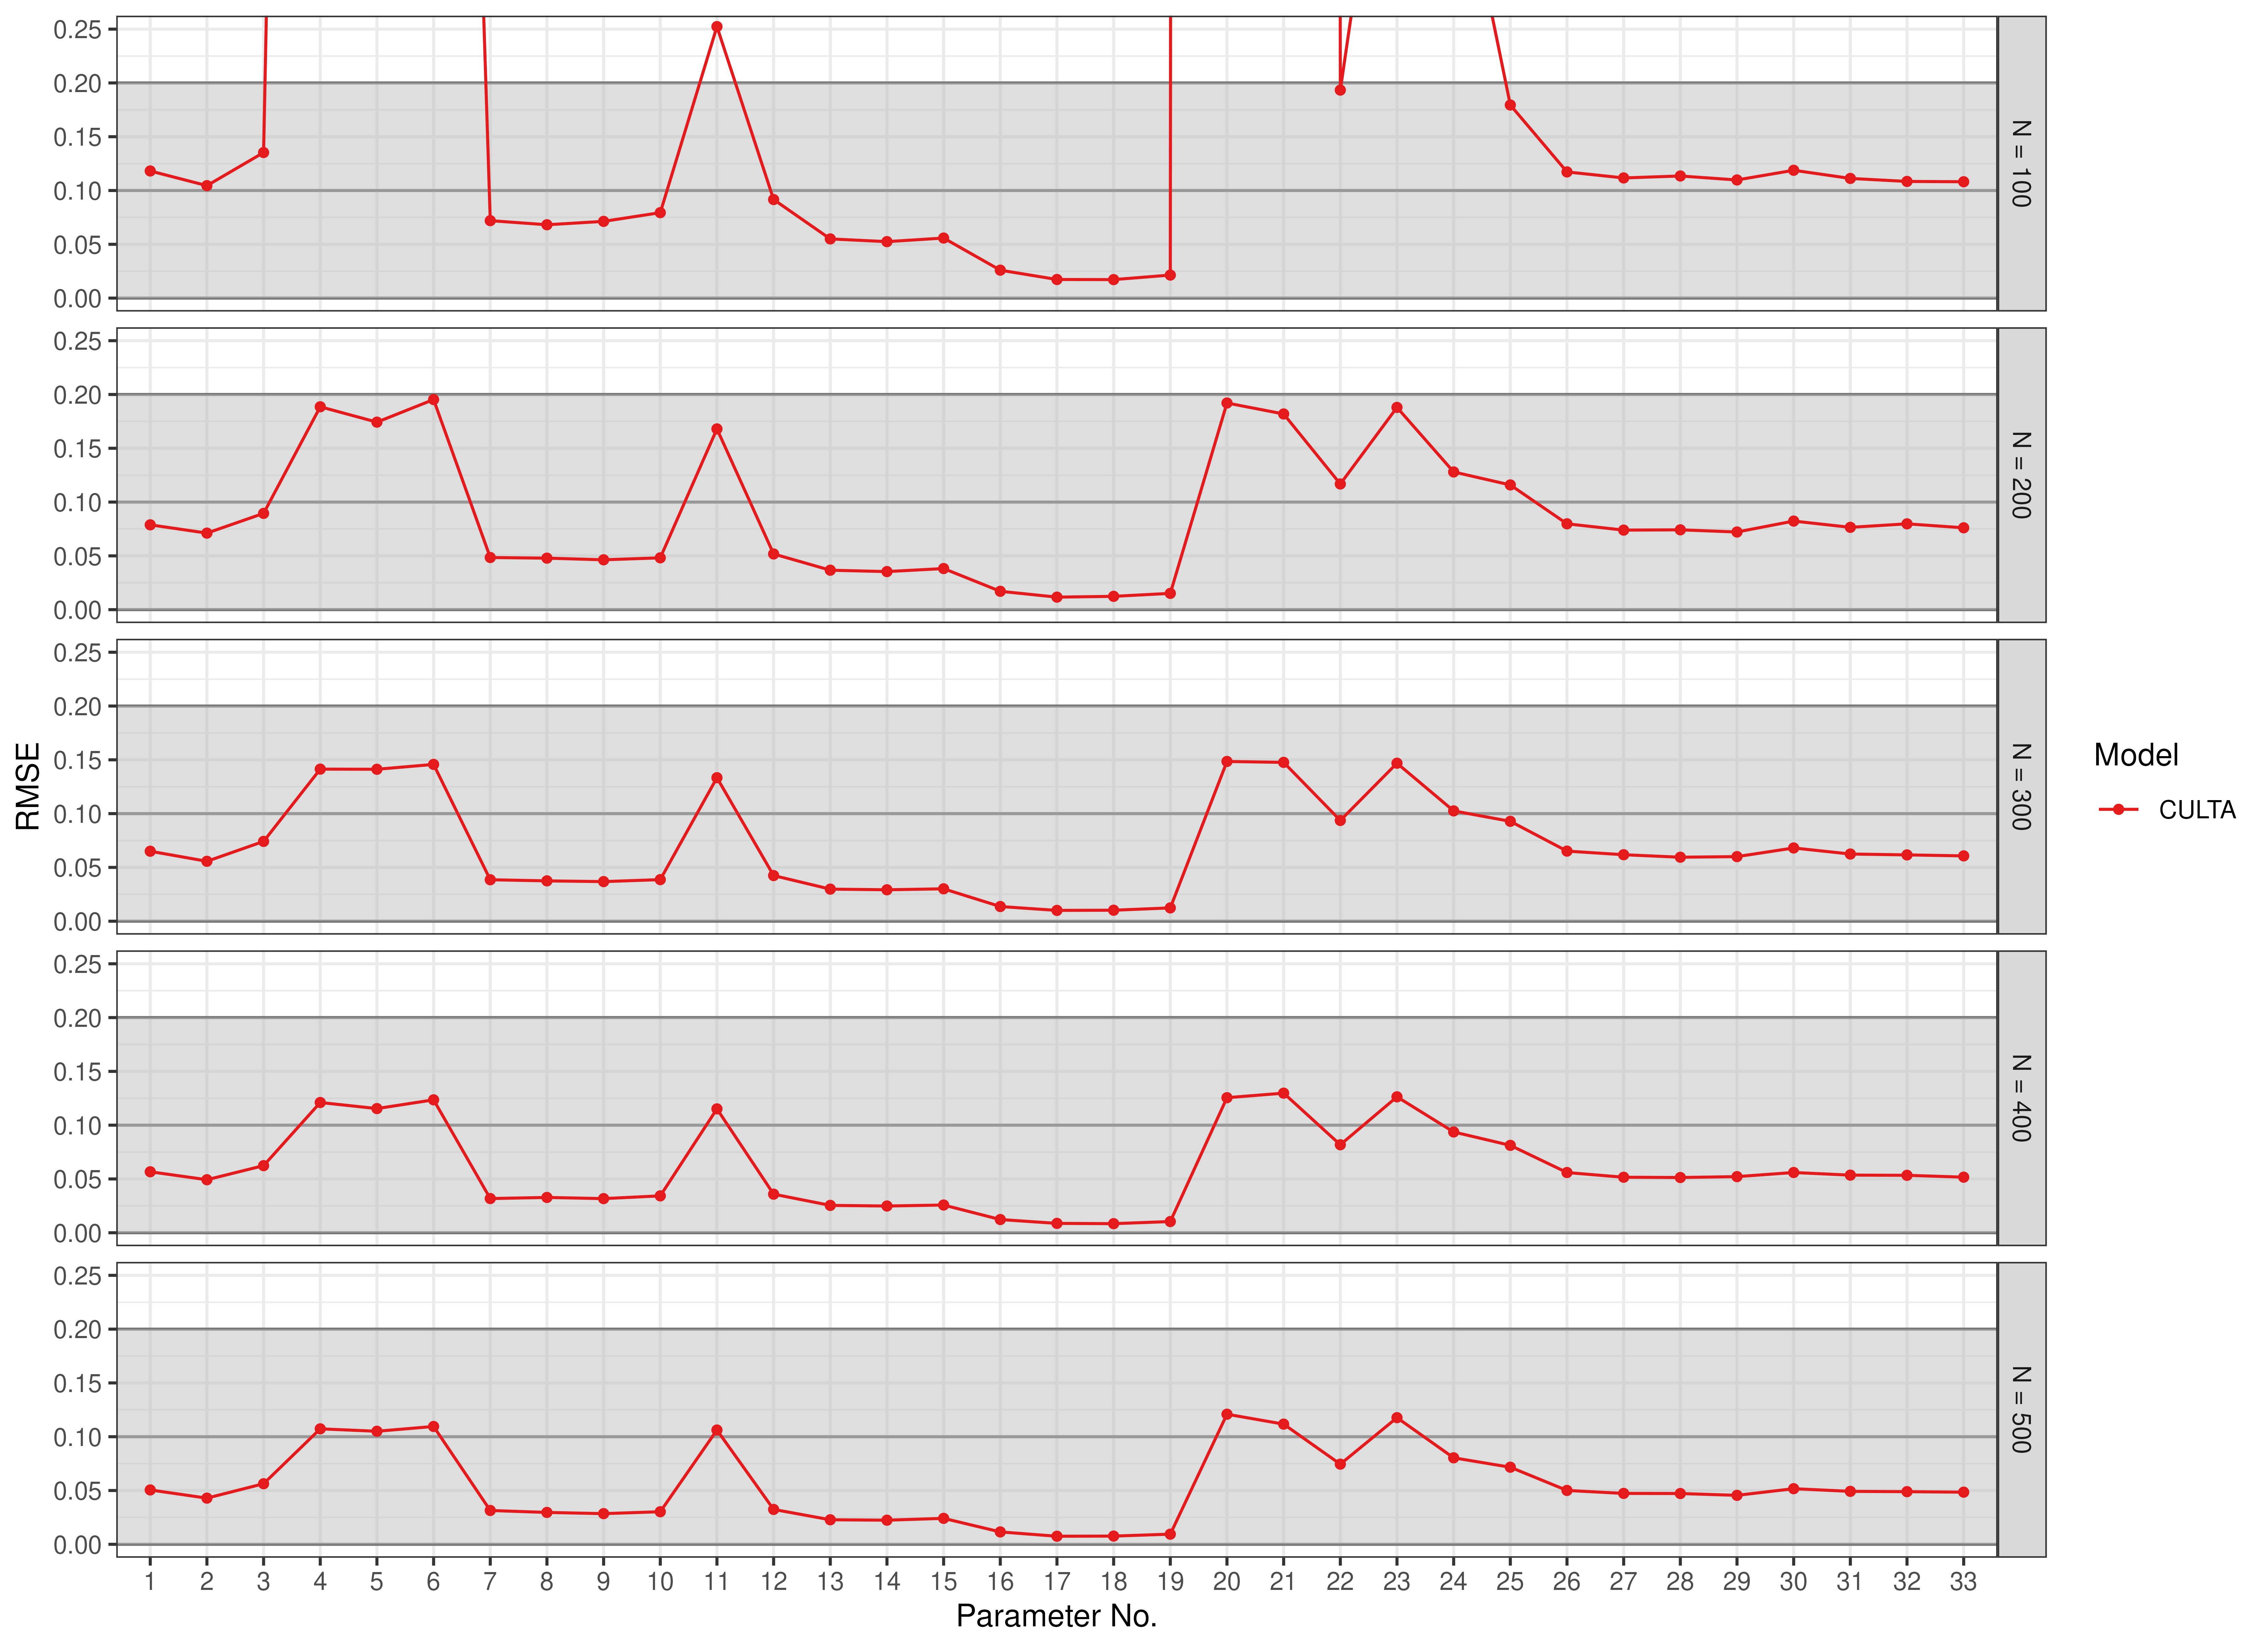
Coverage Probability
data(results_culta_est, package = "manCULTA")
FigCoverageCULTAEst(results_culta_est = results_culta_est)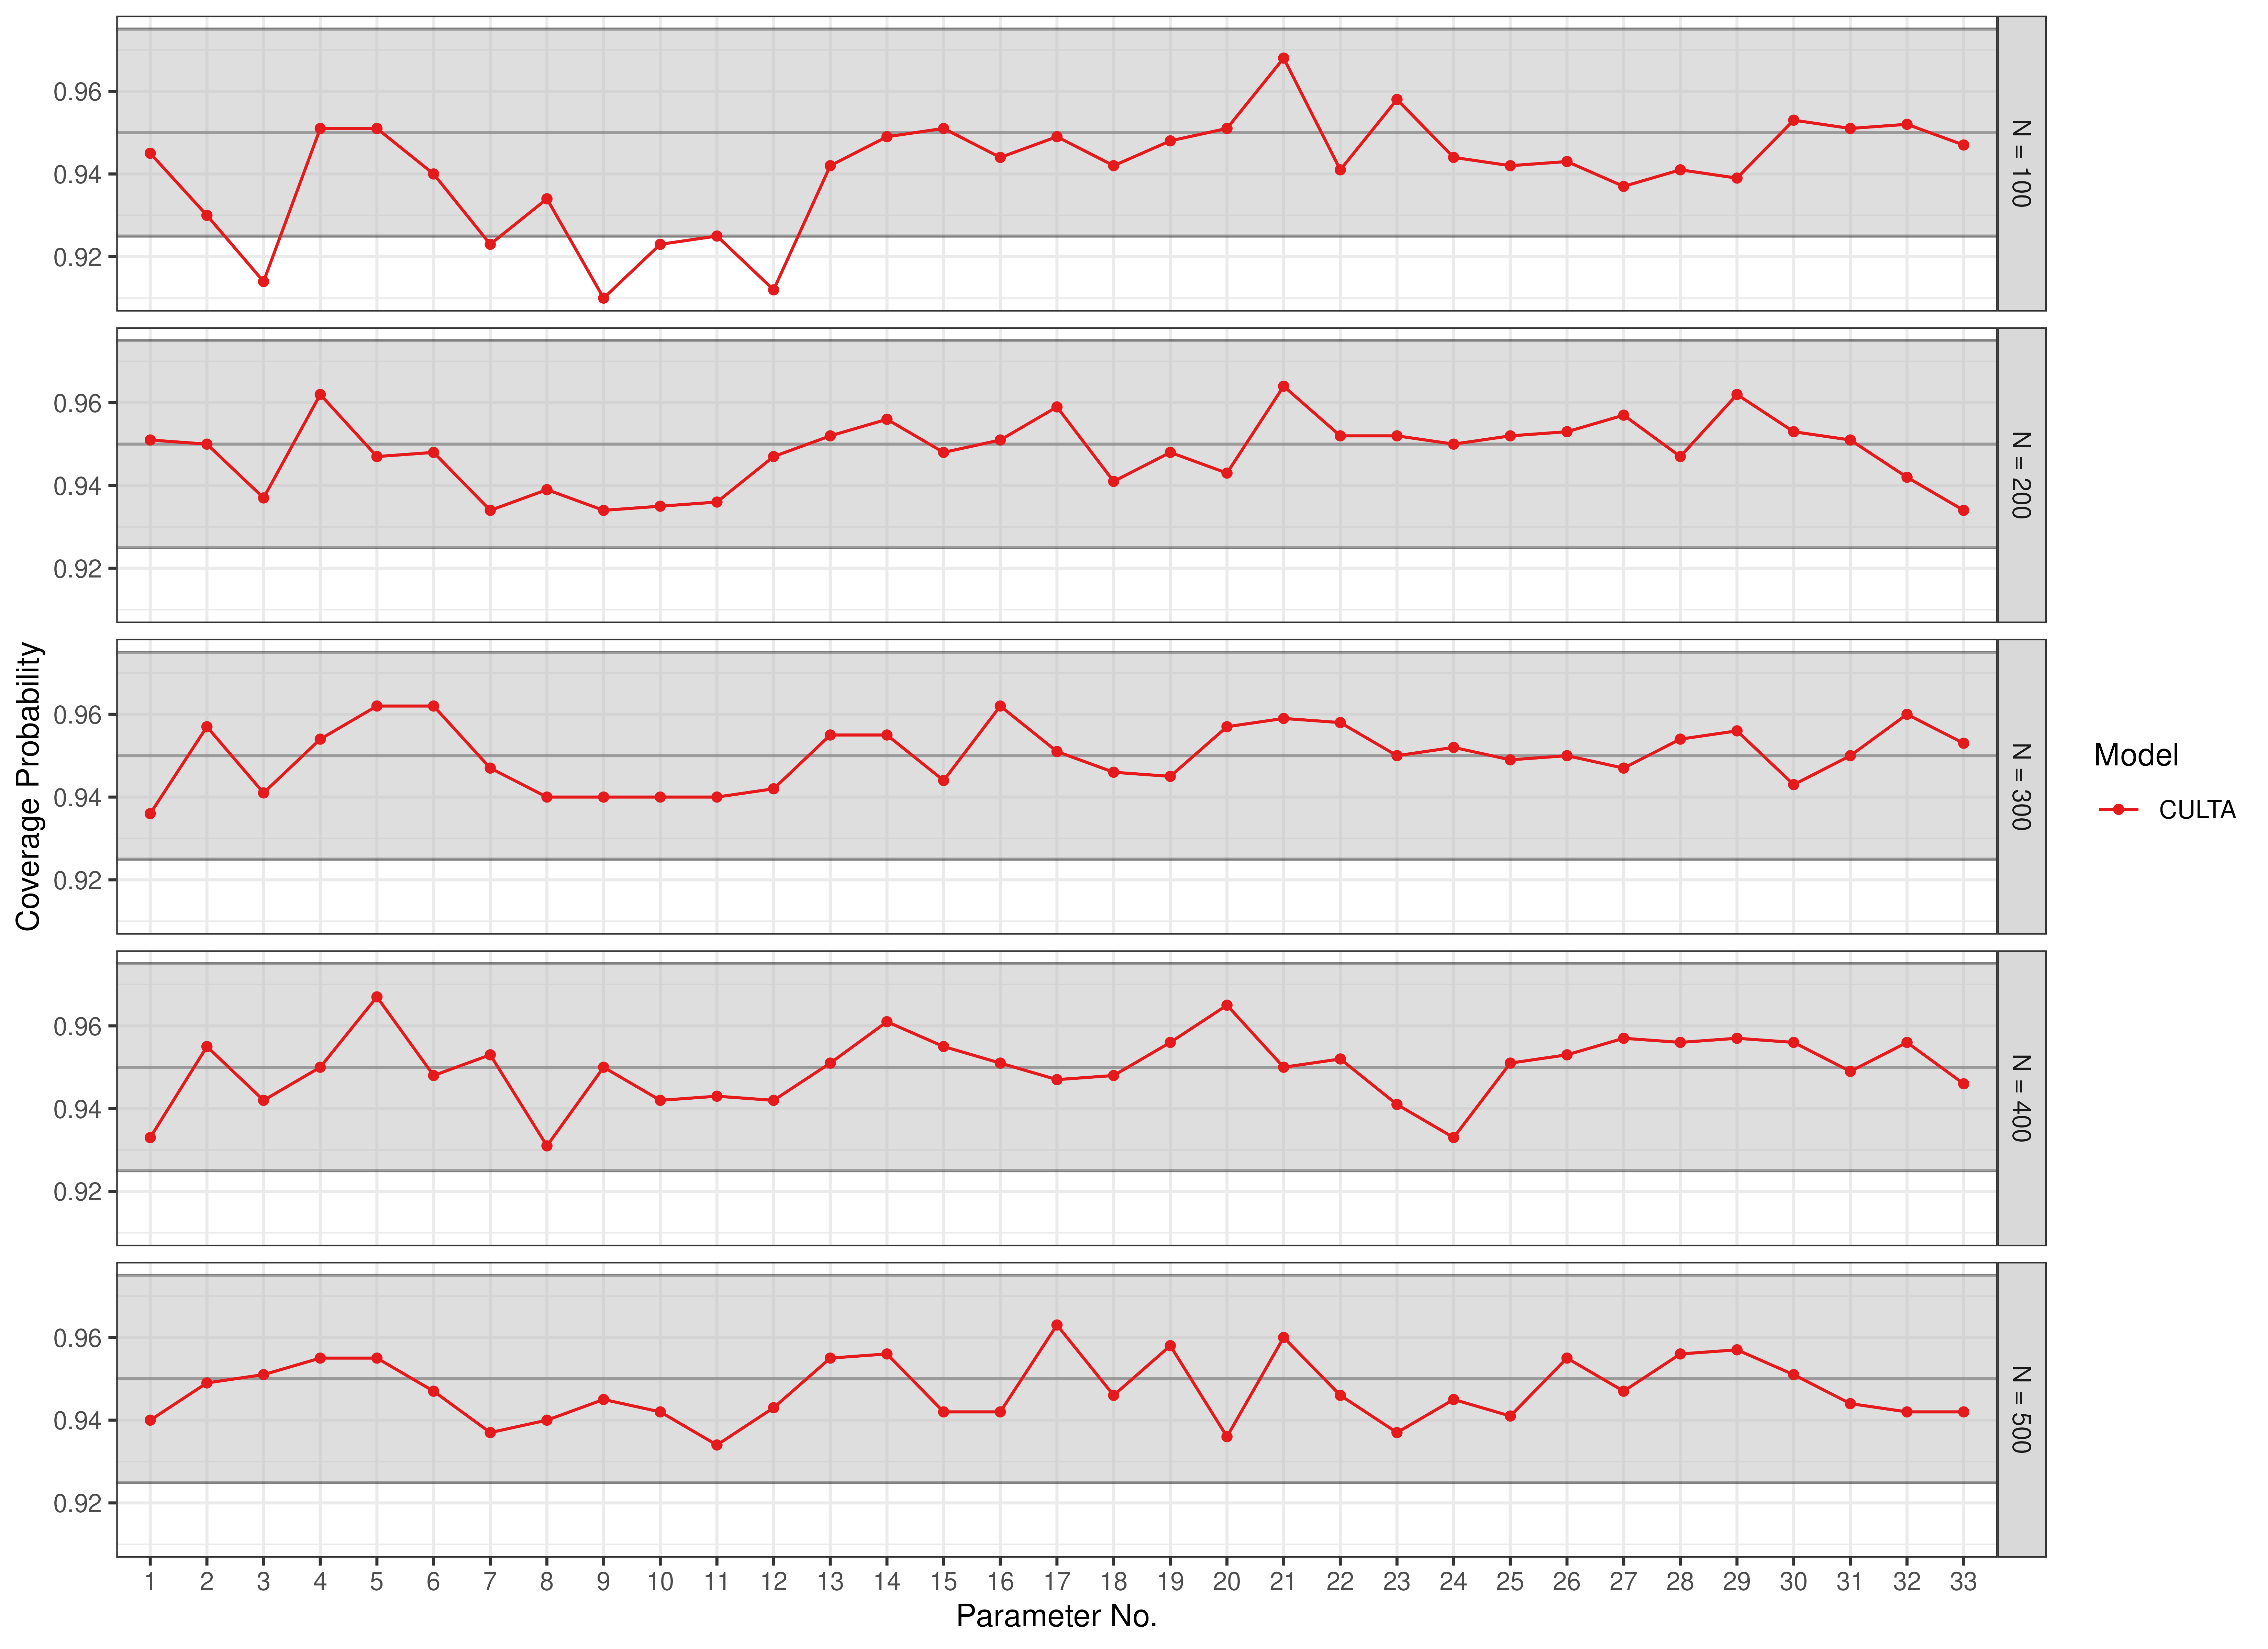
Statistical Power
data(results_culta_est, package = "manCULTA")
FigPowerCULTAEst(results_culta_est = results_culta_est)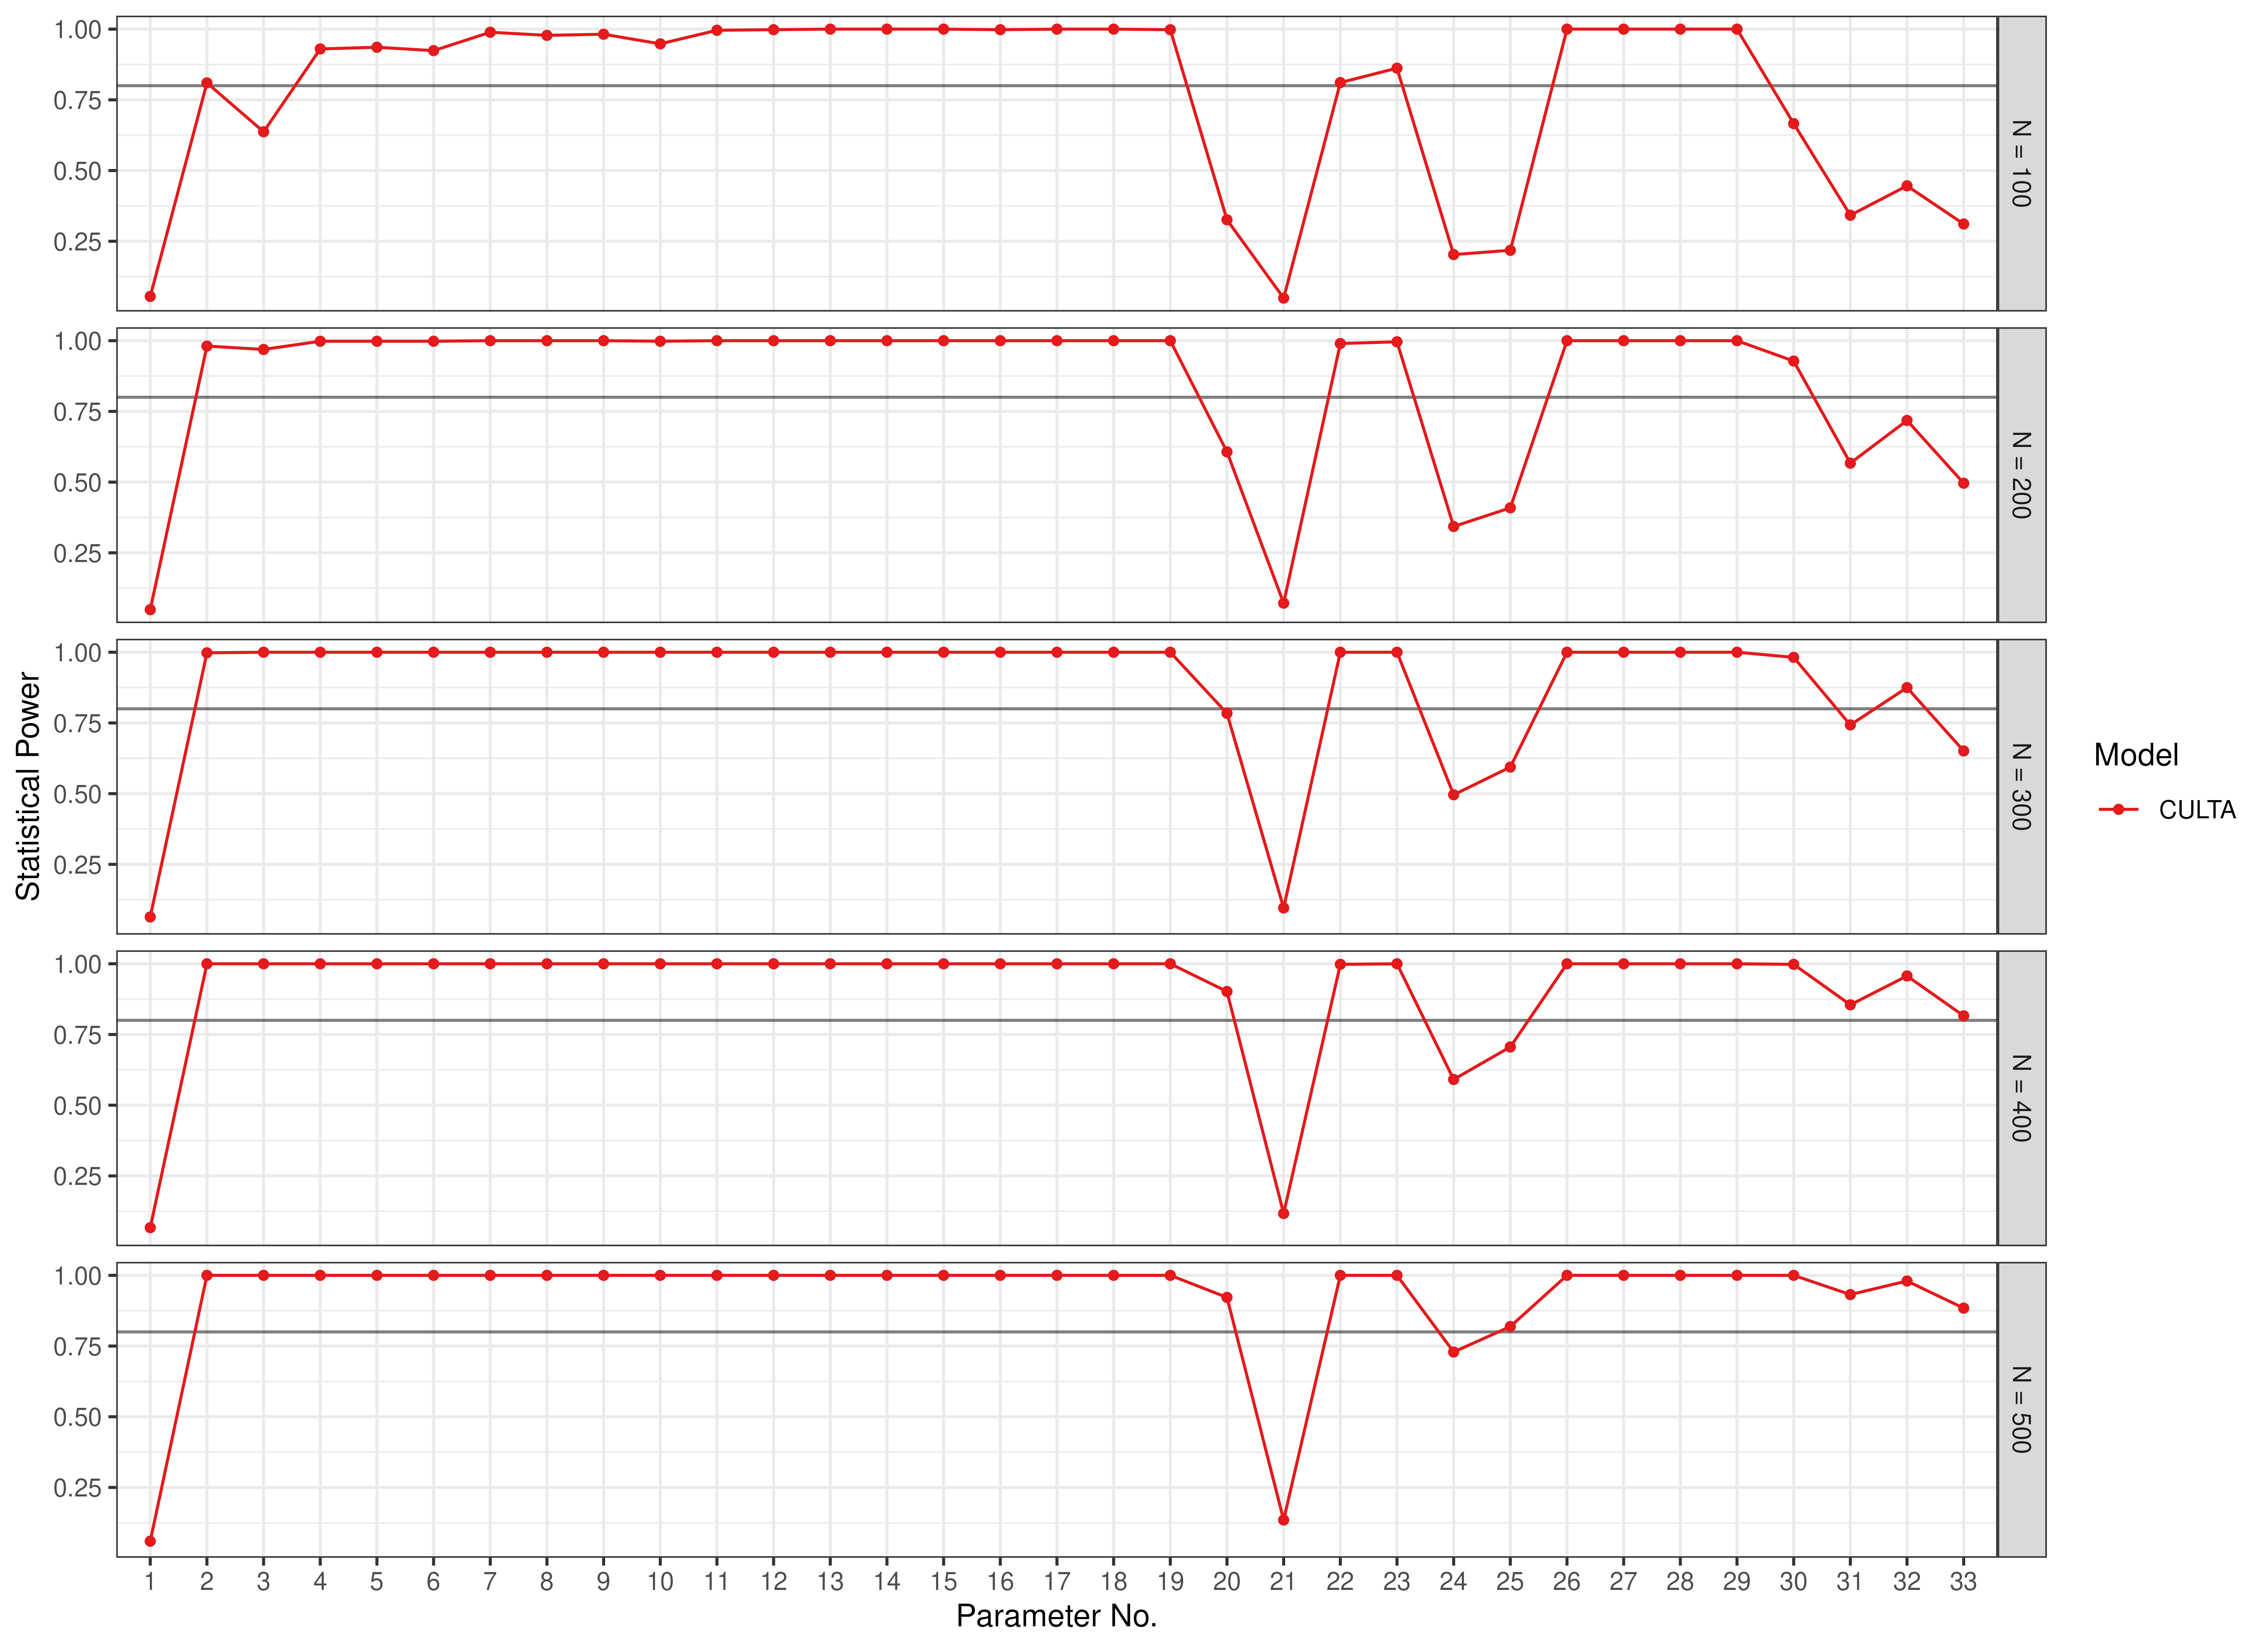
Parameters
The parameters are indexed as follows:
parameter.
Autoregressive coefficient for profile 0.parameter.
Autoregressive coefficient for profile 1.parameter.
Variance in the common trait; reflects stable between-person differences.parameter.
Factor loading for the common trait and item 2.parameter.
Factor loading for the common trait and item 3.parameter.
Factor loading for the common trait and item 4.parameter.
Trait-specific item 1 variance.parameter.
Trait-specific item 2 variance.parameter.
Trait-specific item 3 variance.parameter.
Trait-specific item 4 variance.parameter.
Initial-day variance of the common state; reflects variability in intoxication levels at observation start.parameter.
Residual state variance over days; captures within-person daily fluctuations not explained by trait or AR effects.parameter.
Factor loading for the common state and item 2.parameter.
Factor loading for the common state and item 3.parameter.
Factor loading for the common state and item 4.parameter.
Unique state variance for item 1.parameter.
Unique state variance for item 2.parameter.
Unique state variance for item 3.parameter.
Unique state variance for item 4.parameter.
Intercept for initial log-odds of profile 0 (vs. profile 1) when .parameter.
Covariate effect on initial profile membership; higher increases odds of profile 0.parameter.
Baseline log-odds of being in profile 0 across days.parameter.
Increased odds of staying in profile 0 if previously in that profile; reflects persistence.parameter.
Covariate effect on staying in profile 0; higher increases persistence.parameter.
Covariate effect on switching from state to profile 0; higher increases transition odds.parameter.
Profile specific mean for profile 0 and item 1.parameter.
Profile specific mean for profile 0 and item 2.parameter.
Profile specific mean for profile 0 and item 3.parameter.
Profile specific mean for profile 0 and item 4.parameter.
Profile specific mean for profile 1 and item 1.parameter.
Profile specific mean for profile 1 and item 2.parameter.
Profile specific mean for profile 1 and item 3.parameter.
Profile specific mean for profile 1 and item 4.