Skip to contents

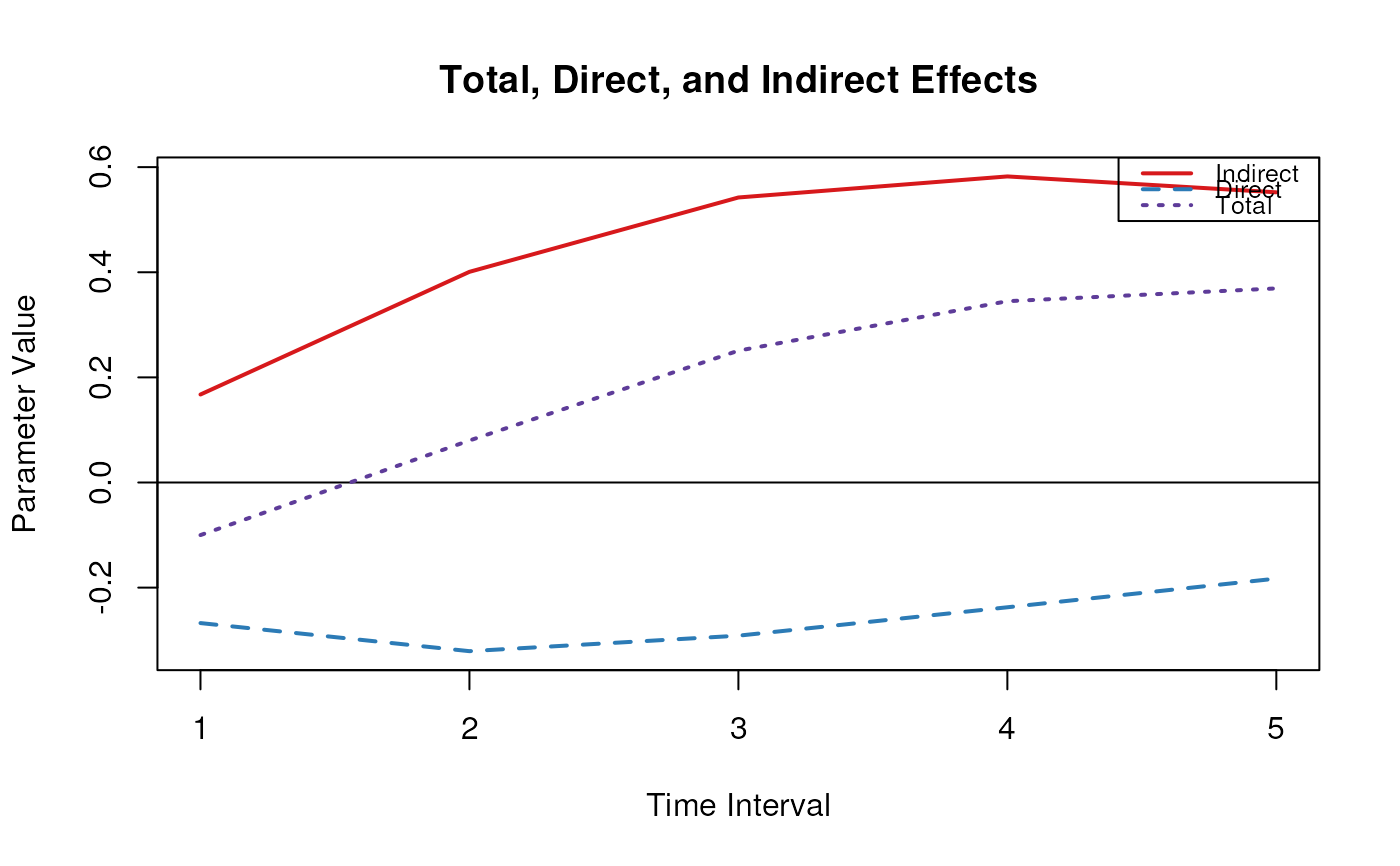
Plot Method for an Object of Class ctmedmed

Usage

# S3 method for class 'ctmedmed'
plot(x, col = NULL, legend_pos = "topright", ...)

Arguments

x

Object of class ctmedmed.

col

Character vector. Optional argument. Character vector of colors.

legend_pos

Character vector. Optional argument. Legend position.

...

Additional arguments.

Value

Displays plots of point estimates and confidence intervals.

Author

Ivan Jacob Agaloos Pesigan

Examples

phi <- matrix(
  data = c(
    -0.357, 0.771, -0.450,
    0.0, -0.511, 0.729,
    0, 0, -0.693
  ),
  nrow = 3
)
colnames(phi) <- rownames(phi) <- c("x", "m", "y")

# Range of time intervals ---------------------------------------------------
med <- Med(
  phi = phi,
  delta_t = 1:5,
  from = "x",
  to = "y",
  med = "m"
)
plot(med)
#> $rect
#> $rect$w
#> [1] 0.7772935
#> 
#> $rect$h
#> [1] 0.1293453
#> 
#> $rect$left
#> [1] 4.382707
#> 
#> $rect$top
#> [1] 0.6184468
#> 
#> 
#> $text
#> $text$x
#> [1] 4.76482 4.76482 4.76482
#> 
#> $text$y
#> [1] 0.5861105 0.5537741 0.5214378
#> 
#>