Plot Method for an Object of Class ctmeddelta
Source: R/cTMed-methods-ctmeddelta.R
plot.ctmeddelta.RdPlot Method for an Object of Class ctmeddelta
Usage
# S3 method for class 'ctmeddelta'
plot(x, alpha = 0.05, col = NULL, ...)Examples
phi <- matrix(
  data = c(
    -0.357, 0.771, -0.450,
    0.0, -0.511, 0.729,
    0, 0, -0.693
  ),
  nrow = 3
)
colnames(phi) <- rownames(phi) <- c("x", "m", "y")
vcov_phi_vec <- matrix(
  data = c(
    0.00843, 0.00040, -0.00151,
    -0.00600, -0.00033, 0.00110,
    0.00324, 0.00020, -0.00061,
    0.00040, 0.00374, 0.00016,
    -0.00022, -0.00273, -0.00016,
    0.00009, 0.00150, 0.00012,
    -0.00151, 0.00016, 0.00389,
    0.00103, -0.00007, -0.00283,
    -0.00050, 0.00000, 0.00156,
    -0.00600, -0.00022, 0.00103,
    0.00644, 0.00031, -0.00119,
    -0.00374, -0.00021, 0.00070,
    -0.00033, -0.00273, -0.00007,
    0.00031, 0.00287, 0.00013,
    -0.00014, -0.00170, -0.00012,
    0.00110, -0.00016, -0.00283,
    -0.00119, 0.00013, 0.00297,
    0.00063, -0.00004, -0.00177,
    0.00324, 0.00009, -0.00050,
    -0.00374, -0.00014, 0.00063,
    0.00495, 0.00024, -0.00093,
    0.00020, 0.00150, 0.00000,
    -0.00021, -0.00170, -0.00004,
    0.00024, 0.00214, 0.00012,
    -0.00061, 0.00012, 0.00156,
    0.00070, -0.00012, -0.00177,
    -0.00093, 0.00012, 0.00223
  ),
  nrow = 9
)

# Range of time intervals ---------------------------------------------------
delta <- DeltaMed(
  phi = phi,
  vcov_phi_vec = vcov_phi_vec,
  delta_t = 1:5,
  from = "x",
  to = "y",
  med = "m"
)
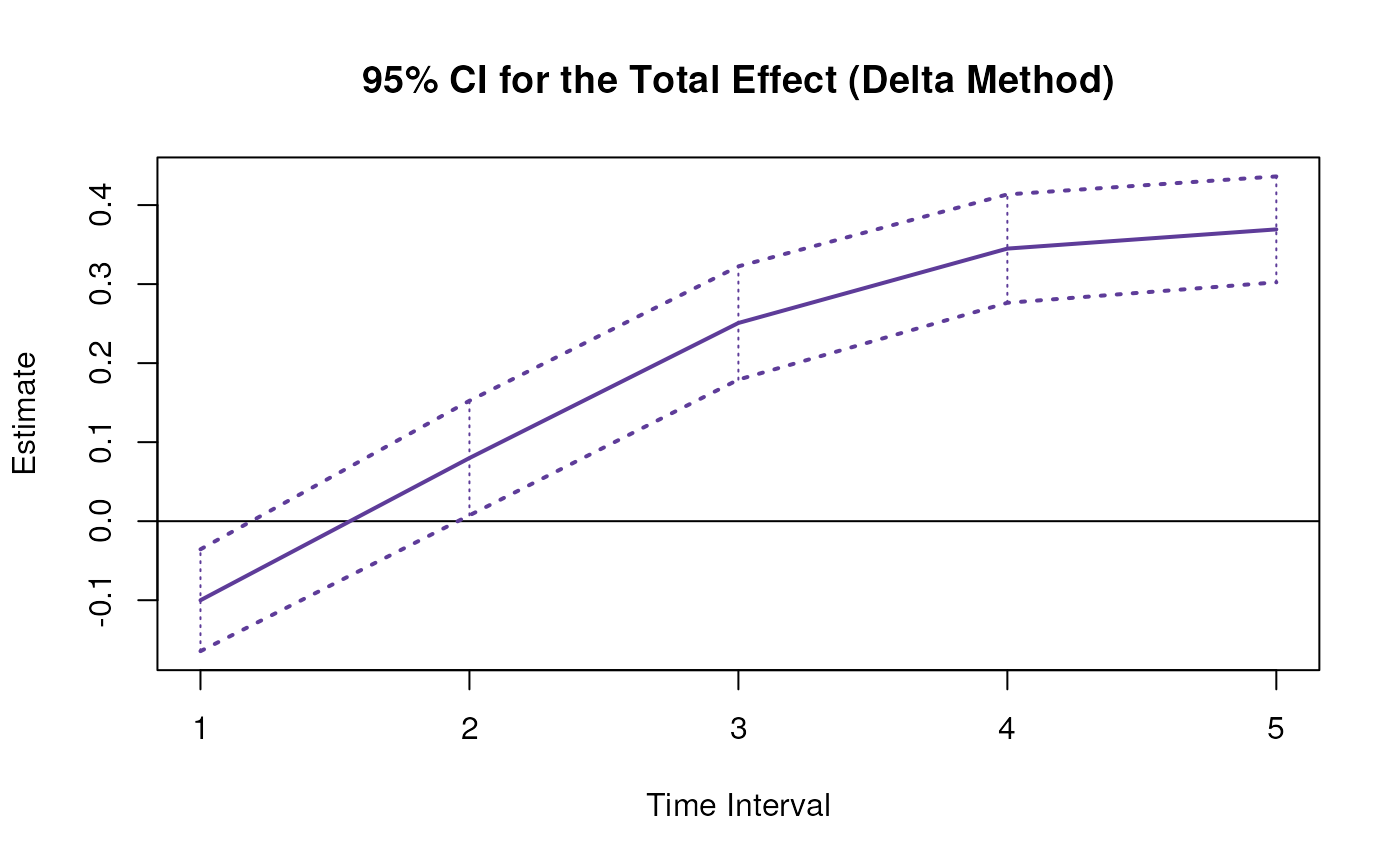
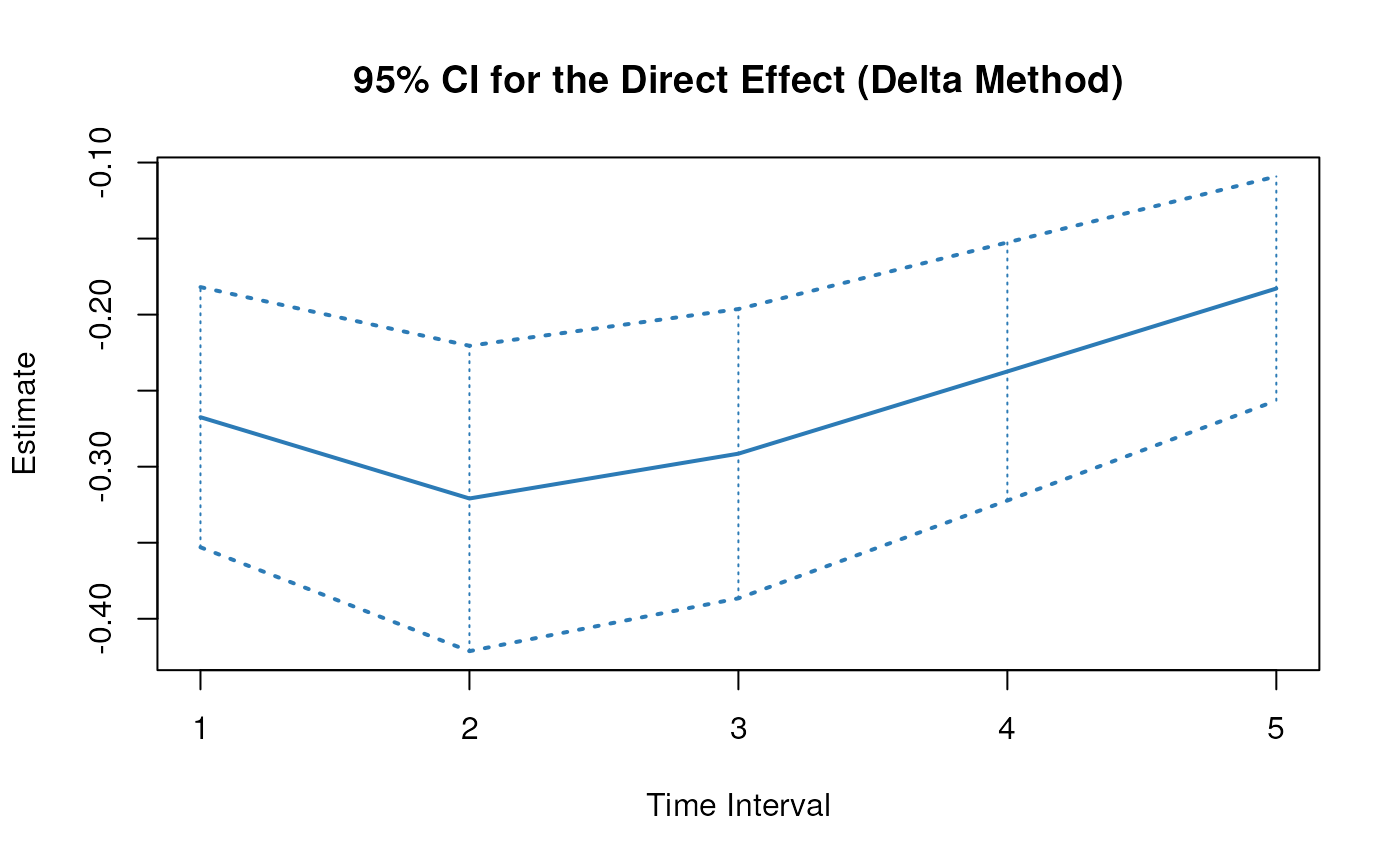
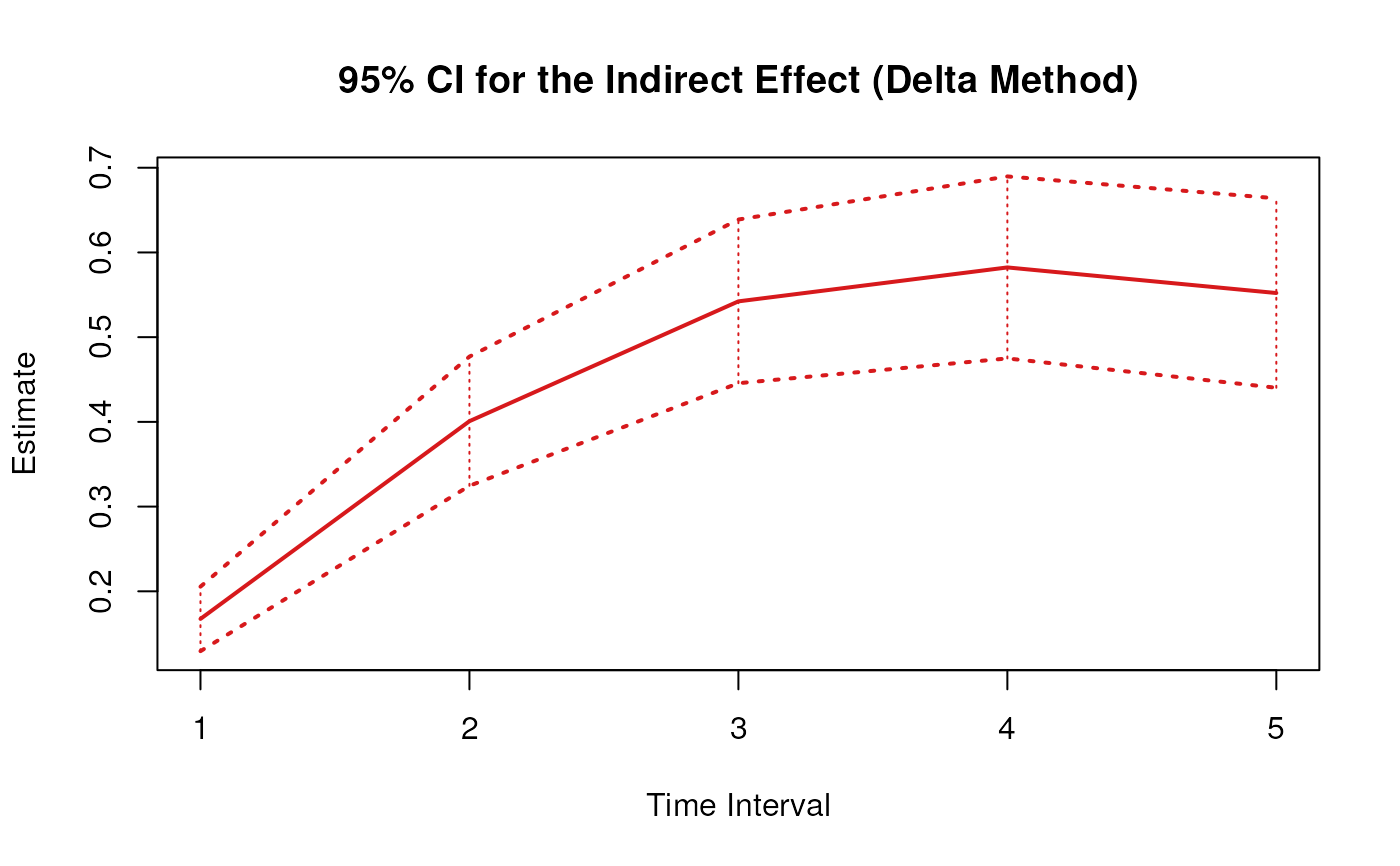
plot(delta)


